Jump to content

Welcome to Geeks to Go - Register now for FREE

Need help with your computer or device? Want to learn new tech skills? You're in the right place!
Geeks to Go is a friendly community of tech experts who can solve any problem you have. Just create a free account and post your question. Our volunteers will reply quickly and guide you through the steps. Don't let tech troubles stop you. Join Geeks to Go now and get the support you need!

How it Works Create Account
Photo

Excel filter help


  • Please log in to reply

#1
TheCrazyFrog

TheCrazyFrog

    Member

  • Member
  • PipPip
  • 12 posts
Hey, basically im doing a spread sheet of results of a questionnaire. I have put each question in a column near the top, then in the column beneath had a box for the answer for each tick box that was available. For example, male or female? then beneathe i had a column for male & one for female. when someone answered female then i'd add a "1" into that box. so each of the 40 people i interviewed had their own row, eg if it was a male - 17 - liked football, they have a "1" in the column of each of these answers, and a blank column for each of the other answers.

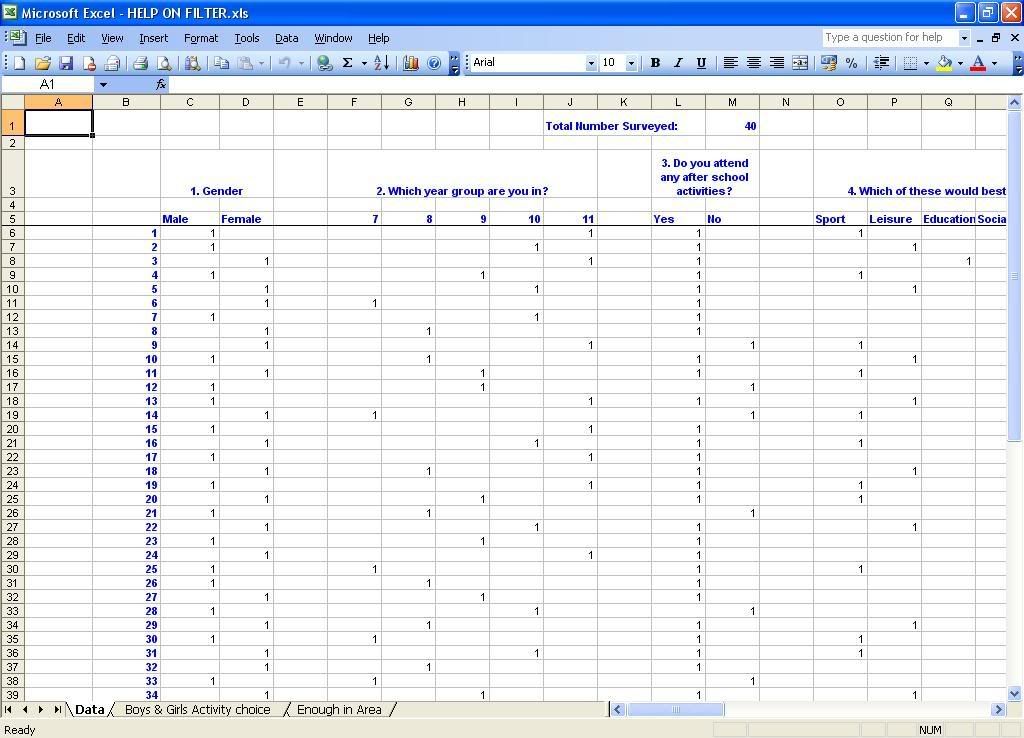
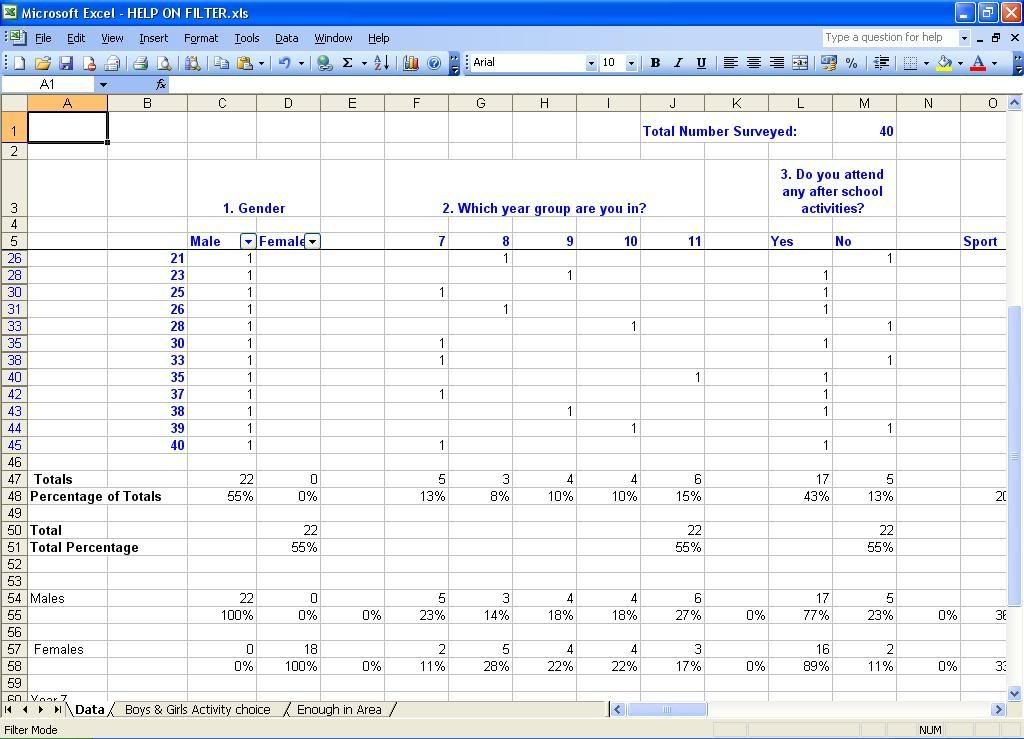
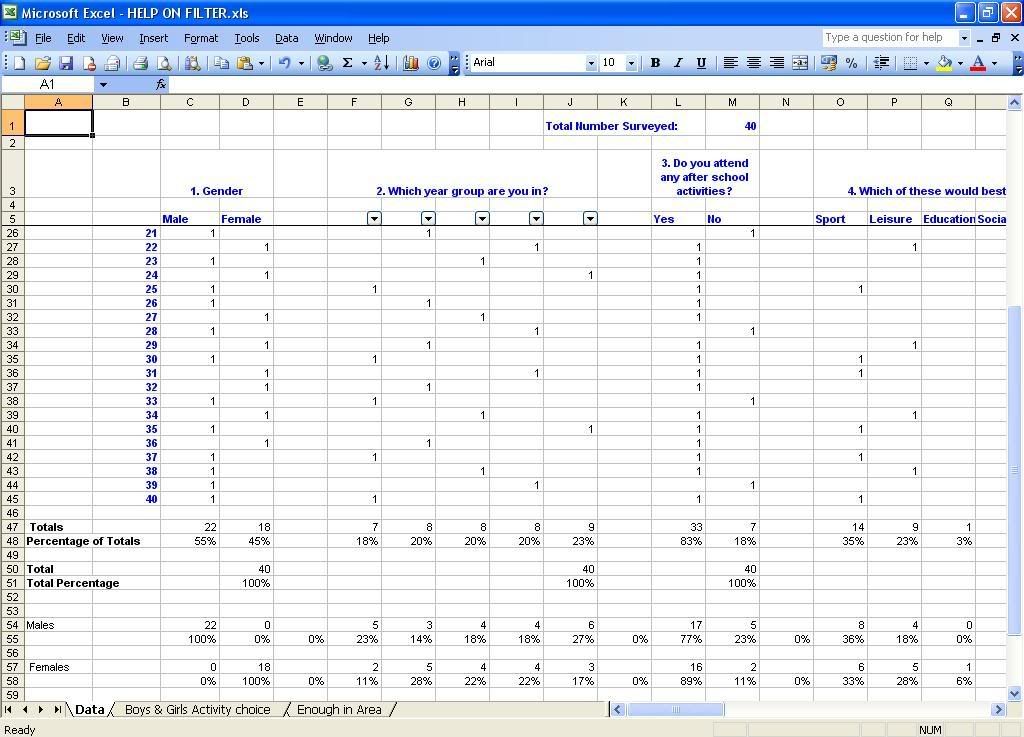
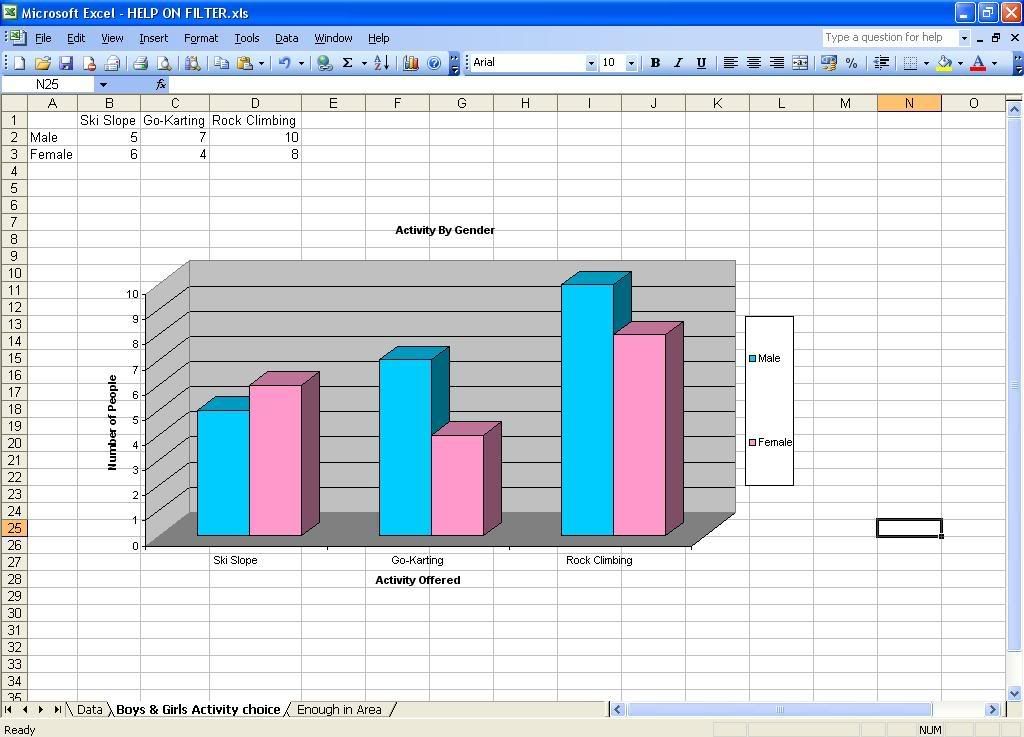
My teacher added a filter to the MALE and FEMALE columns on question 1. She then did something at the bottom, made a new row one saying male, one saying female, and using the filter (first she did males, and made only the data that had a "1" in the male column show) she did totals at the bottom. This allowed me to compare female vs male with comparative pie charts and bar charts, however i click on the box and it shows no formulae, maybe it was lost in transition between school and home im not sure, but basically, i want to do something similar with age groups so i can see which age group can make what time//what activity they want.

I hope you understand what i mean, here are a few screenshots of my spread sheet to hopefully help you understand what i need, sorry i found it hard to explain :whistling:

Posted Image

Posted Image

Posted Image

Posted Image
  • 0

Advertisements


#2
TheCrazyFrog

TheCrazyFrog

    Member

  • Topic Starter
  • Member
  • PipPip
  • 12 posts
no worries i sort the problem, i used a filter on each individual row for age, individually adding all the 1's up, then copyed this formular across so it only counted the numbers in the same row as the certain people's ages. :whistling:
  • 0

#3
TheCrazyFrog

TheCrazyFrog

    Member

  • Topic Starter
  • Member
  • PipPip
  • 12 posts
hi, i inserted an "auto filter" into my excel questionnaire results, i added it to males and females, so that when i changed the filter to "1" on males, i could see what all the males answered in the questionnaire, i then added all male cells together by a simple sum (=C6+C7+C9+C12+C15+C17+C18+C20+C22+C24+C26+C30+C28+C31+C33+C35+C38+C40+C42+C43+C44+C45)

this meant that i could drag this formula across and when someone answered "yes" (there is a 1 in that answer field box) for anyother question it would total it up at the bottom, and i could see how many males answered what, i did the same thing for females, so eventually i had for each questions what females & males thought, so i could produce graphs comparing the two.

my question is what is the sum to add all the cells together only if the male column has a 1 in, basically what is the quick way to do what i have just explained?

thanks for anyone trying to help, sorry if my explanation is slightly confusing
  • 0


Similar Topics

0 user(s) are reading this topic

0 members, 0 guests, 0 anonymous users

As Featured On:

Microsoft Yahoo BBC MSN PC Magazine Washington Post HP