Jump to content

Welcome to Geeks to Go - Register now for FREE

Need help with your computer or device? Want to learn new tech skills? You're in the right place!
Geeks to Go is a friendly community of tech experts who can solve any problem you have. Just create a free account and post your question. Our volunteers will reply quickly and guide you through the steps. Don't let tech troubles stop you. Join Geeks to Go now and get the support you need!

How it Works Create Account
Photo

MS Excel Challenege


  • Please log in to reply

#1
LSEactuary

LSEactuary

    Member

  • Member
  • PipPip
  • 79 posts
Hi,

This is quite urgent.

5 different IT guys have worked on this challenge and no-one has yet been able to provide a full proof answer. So here goes...

If you open the Excel file (http://www.mediafire...1hqd5jmirlyxliy) you will see that on Sheet 1 there are 3 columns. The first is the data and the other 2 columns show countries.

On sheet 2 there are 2 tables. The table on the LHS shows the totals when using excel. The table on the RHS shows totals when I calculated it by hand/manually. Both are clearly wrong as on sheet 1 there is 272 data rows and the total of each of the tables is quite different from this.

Sheet 3 shows some calculations using sheet 1. please drag the formula down (i couldnt because the file became too large to attach).

I basically need to use the data in sheet 1 and complete the LHS table in sheet 2. it sounds simple but no-one has provided a full solution just as yet. Ideally I need a UK-Western Europe row in the table too but its okay if its not there.

Feel free to do whatever you want to that excel file - only the table on sheet 2 will be handed in.

Note:
Column 2 - UK, Column 3 - France is the same as Column 2 - France, Column 3 - UK
N/A means UK is not in Column 2 or Column 3.

Please note that I have to do the same thing for about 25 different data sets (each with about 200+ rows) and so a quick solution will be the best! :D

Good luck!

Edit: please dont paste an answer without an explanation of how I can do it in excel. I have 25 data sets so need to know how to get the table.

Edited by LSEactuary, 29 December 2010 - 10:29 AM.

  • 0

Advertisements


#2
Vino Rosso

Vino Rosso

    Visiting Staff

  • Visiting Consultant
  • 235 posts
How about...

Posted Image

Edited by Vino Rosso, 29 December 2010 - 03:12 PM.

  • 0

#3
LSEactuary

LSEactuary

    Member

  • Topic Starter
  • Member
  • PipPip
  • 79 posts
OMG OMG HOW DID YOU DO THAT?

I’m on the live chat for about 2 more hours.... please let me know how you did this!

Edit: I just realised that the table is slightly incorrect. In the data set there is data which doesn’t have UK in either column and your table above has taken this into 'rest of the world'. I am deleting all the rows that don’t have 'UK' in them to eliminate this problem but can you please let me know how you got this table.

and can you try including an option for 'Western Europe'? (Covering several countries)

Edited by LSEactuary, 29 December 2010 - 10:36 AM.

  • 0

#4
Vino Rosso

Vino Rosso

    Visiting Staff

  • Visiting Consultant
  • 235 posts

OMG OMG HOW DID YOU DO THAT?

Pivot table

Edit: I just realised that the table is slightly incorrect. In the data set there is data which doesn’t have UK in either column and your table above has taken this into 'rest of the world'. I am deleting all the rows that don’t have 'UK' in them to eliminate this problem but can you please let me know how you got this table.

Ah sorry, I uploaded the wrong pivot table. I've now changed it - see above.
  • 0

#5
LSEactuary

LSEactuary

    Member

  • Topic Starter
  • Member
  • PipPip
  • 79 posts
Can you please give me step by step instructions or upload the excel file so I can try and understand how you did this. I've not used a pivot table before and did google around for hours regarding this but got nowhere. This is seriously urgent so please please please help me out....
  • 0

#6
LSEactuary

LSEactuary

    Member

  • Topic Starter
  • Member
  • PipPip
  • 79 posts
I need to produce the same table for another 25 data sets so please explain how you got the table in detail. 5 of the tables will be UK-something but the others will be France-something and so on so please explain how I can produce the pivot table.

Also is there a way of splitting the 'rest of the world' bit into 'western Europe' and 'rest of the world'? If not it doesn't matter that much - I'm just curious.

Please no yes/no answers - please provide some detail as to how I can form what you have.

I need to hand this in tomorrow (extended deadline) so please reply asap. otherwise I'll have to count it all manually which will be crazy!!!
  • 0

#7
Vino Rosso

Vino Rosso

    Visiting Staff

  • Visiting Consultant
  • 235 posts
Unfortunately, it's very late at night with me and I'm heading for bed. I can post something late tomorrow morning.

Which version of Excel are you using?
  • 0

#8
LSEactuary

LSEactuary

    Member

  • Topic Starter
  • Member
  • PipPip
  • 79 posts
I'm using excel 2003.
How late morning (UK time)?
Isn't there something I can do in the meantime?
  • 0

#9
dm27

dm27

    Member

  • Member
  • PipPipPip
  • 272 posts
Hello LSEactary,

While I don't want to step on Vino's toes here, I just wanted to offer some additional notes. I used a helper column (actually 2) to permit my pivot table to count the items correctly. I've attached a Jpg file with a couple of screen shots.

Here are a couple of links to Pivot Table help from the Microsoft site:
Pivot Table 101

Pivot Table 102

Best of luck to you,

dm

Attached Thumbnails

  • Notes.JPG

  • 0

#10
LSEactuary

LSEactuary

    Member

  • Topic Starter
  • Member
  • PipPip
  • 79 posts
Hi,

Thanks guys for all the notes but im clueless where to start. Ive read through the noted and MS websites, asked so many people for help etc but all I see is 3 columns of dats and have no idea how you are forming the pivot table etc from that. Therefore can you please provide step by step instructions of how to convert this: http://www.mediafire...mse57wlcj5samvs into the correct pivot table? I have loads to get through today so please please please provide really basic and clear instructions.

The MS websites were useful but my table looks more complicated then whats on the website and therefore I need some help.

Thanks

Edited by LSEactuary, 30 December 2010 - 03:24 AM.

  • 0

#11
Vino Rosso

Vino Rosso

    Visiting Staff

  • Visiting Consultant
  • 235 posts

While I don't want to step on Vino's toes here...

No problem dm, chip in where you can :D

As ever with Excel, there are several ways to achieve the same outcome. I'll try to simplify the steps here.

1) Given you want UK (col 2) v France (col 3) to be counted the same as UK (col 3) v France (col 2), I suggest getting your initial data into the same columns.
Add headers to the columns, say, Date/Country1/Country2.
Select all three columns then Data > Sort > Country2 > Ascending
Scroll down and where Country2 is United Kingdom, move the Country1 data into the Country2 column (overwrite United Kingdom)
For the blank cells left in Country1 column (that you just moved), replace with United Kingdom.

2) Select all three columns then Data > Sort > Country1 > Ascending
Add two more column headers, say, Region1 (col D) and Region2 (col E)
The following could be done with a lookup but, as there are not many entries and in case of problems, let's take this route...
In column D, type Rest of the World, France, Germany, etc. depending on Country1. These entries can be copy/dragged.
Select columns A to D then Data > Sort > Country2 > Ascending
In column E, type Rest of the World, France, Germany, etc. depending on Country2. These entries can be copy/dragged.

You should now have the data as needed for the pivot table. Again, there are other ways to do the above but I'm hopefully keeping things fairly simple for you.

3) Click anywhere in the data then Data > PivotTable and PivotChart Report...
The Pivot Wizard will appear (step 1 of 3)
Leave the default selections (MS Office Excel list or database and PivotTable)
Click Next >
Step 2 of 3 shows the data range (if you clicked in the data before starting, Excel will pick up the range automatically, Sheet1!$A$1:$E$273
Click Next >
Step 3 of 3, leave as the default of New worksheet
Click Finish

A new worksheet will open with some blank squares/oblongs and a list of data fields on the right.

Click on Region1 in the list and drag it to the Row Field of the pivot table.
Click on Region2 in the list and drag it between the Region1 field and the Data Field.
(Let go of your mouse button when you see a thin fuzzy vertical line to the right of the Region1 field.)
Click on Date in the list and drag it to the Column Field of the pivot table.
Right-click on 'Date' in the pivot table and select Group and Show Detail > Group
Scroll down and click on Years. Make sure other options are deselected by clicking on them as necessary.
Click OK. (You should now only have the years as columns headers.)
Drag Region2 from the list into the Data Field.

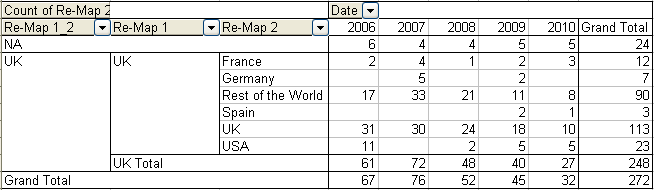
You should now have a pivot table with various Region1 entries down the left where you only want UK or NA.

Click on the first non-UK Region1 name in the left column of the pivot table.
Hold down the Ctrl key and click on the other non-UK Region1 names so they are highlighted.
Right-click on the name and select Group and Show Detail > Group
A new column will appear on the left of the pivot table, showing UK and Group1
Double-click on Group1 to expand/collapse the detail.
Click on Group1 and edit the name as required in the textbar.

Again, there are several ways to do the same thing in Excel. If others can simplify the above... please do!
  • 0

#12
LSEactuary

LSEactuary

    Member

  • Topic Starter
  • Member
  • PipPip
  • 79 posts
THANK YOU SOOOOOOOOOOOO MUCH!
Problem Solved! :D

and 10/10 for your instructions...
Happy New Year everyone! ;)

Edited by LSEactuary, 30 December 2010 - 06:27 AM.

  • 0


Similar Topics

0 user(s) are reading this topic

0 members, 0 guests, 0 anonymous users

As Featured On:

Microsoft Yahoo BBC MSN PC Magazine Washington Post HP