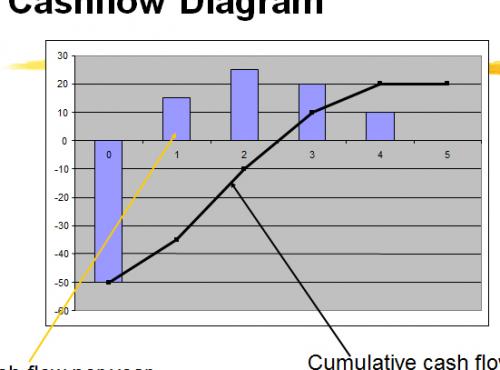
EXCEL - Produce bar graph with a line
Started by
tiroshii
, Dec 12 2011 07:54 PM
#1

 Posted 12 December 2011 - 07:54 PM

#2

 Posted 12 December 2011 - 09:46 PM

Hi Tiroshii,
Depending on your data, you would graph them to the same chart. One will be formatted as a column chart on the primary axis and the second data set would be formatted as a line chart on the secondary axis...
Do you have some sample data we could test with?
Thanks,
dm
Depending on your data, you would graph them to the same chart. One will be formatted as a column chart on the primary axis and the second data set would be formatted as a line chart on the secondary axis...
Do you have some sample data we could test with?
Thanks,
dm
#3

 Posted 13 December 2011 - 04:22 AM

One way is to create a column chart so all the data is shown in columns. Then right-click on the data you want to show as a line and select Change Series Chart Type... click Line > OK
Similar Topics
0 user(s) are reading this topic
0 members, 0 guests, 0 anonymous users
As Featured On:


 Sign In
 Create Account

