Hi Macboatmaster,
Thank you for your replies.
The guide I sent you is only of course a general over view, but the principles of the page file, indexing and the restore points are I think IMHO very relevant.
We addressed these topics earlier. Indexing of all drives is off. Page file size is 16.3GB. That is equal to size of RAM plus 300MB for overhead. System Restore is set to 1%, its lowest possible value.
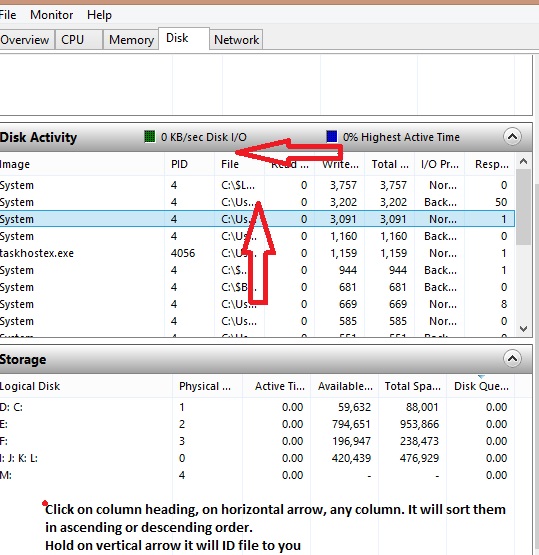
RESOURCE MONITOR
In simple terms if you hold your mouse on the process it will show you what the process is.
If the Image column width is insufficient to show the entire location of the image, holding the mouse on the entry does display the entire location. In my case, I have made all the column widths great enough so that hovering isn't needed. Did I misunderstand you?
Re Resource Monitor - activity depending on where you look is in KB`s per second.
I was asking about the blue line that appears on the graph of the E disk activity. It always maxes out when an application hangs. What does that blue line tell me? Is that KB/sec? The green line on that same graph shows continuous activity, but it is not always at max. IOW, the blue line is indicating an anomaly while the green line looks fairly normal. How do I interpret that. I think the blue line indication is at or near the root of the problem because the blue line always maxes out when an application hangs.
On resource monitor click help, then click the link on that page, then click on
Resource Availability Troubleshooting Getting Started Guide for Windows Server 2008 R2 and Windows 7
I'm studying that now.
I have been doing some more examination of the part of the logs you sent.
These if they have occurred recently, as well raise a concern in my mind
I think you should check if there is a recent occurrence of the same and taking them in turn
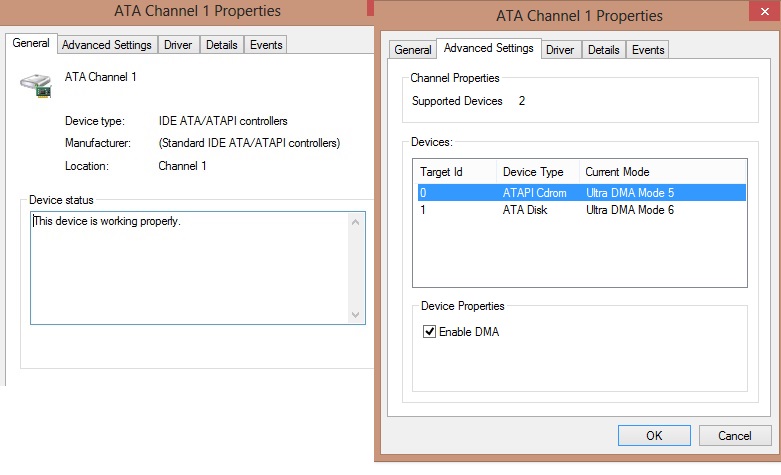
1. controller error on device\ide\port1 The most recent Application Error was logged yesterday 2/21/2013 1:13:57 PM:
The program DllHost.exe version 6.1.7600.16385 stopped interacting with Windows and was closed. To see if more information about the problem is available, check the problem history in the Action Center control panel.
 Process ID: d88
 Start Time: 01ce105f12fc9e49
 Termination Time: 34934
 Application Path: C:\Windows\system32\DllHost.exe
 Report Id: 5cb0ed4b-7c52-11e2-a1cc-50465da74f50
Source Application Hang
The next previous one was on 2/20/2013 3:55:58 PM
2. cpuz135 - Could be CPUID software have you installed I cannot find it on Speccy.CPUZ is a utility that checks RAM. It repeatedly exercised RAM for about an hour and detected no problems. I deleted CPUZ some days back.
3. Spybot Search and Destroy - if you DO have it UNINSTALL it. Use either SAS which you mention or another spyware adware scan - Spybot S&D especially with Tea Timer will cause you problems I deleted Spybot Search & Destroy some days back. Teatimer was never installed.
In the hour or so of use today, the PC hung only once, and that was for less than a minute. When I sorted the write activity to the E disk in Resource Monitor, the application doing the most writing per second changed several times. None of the most active processes was related to the hung application (WinRAR).
Thanks again.
RayGo


 Sign In
 Create Account
