I got distracted and let it run for longer. Sorry. Here it is.
_________________________________________________________________________________________________________
CONCLUSION
_________________________________________________________________________________________________________
Your system seems to be having difficulty handling real-time audio and other tasks. You may experience drop outs, clicks or pops due to buffer underruns. One or more DPC routines that belong to a driver running in your system appear to be executing for too long. At least one detected problem appears to be network related. In case you are using a WLAN adapter, try disabling it to get better results. One problem may be related to power management, disable CPU throttling settings in Control Panel and BIOS setup. Check for BIOS updates.
LatencyMon has been analyzing your system for 0:01:17 (h:mm:ss) on all processors.
_________________________________________________________________________________________________________
SYSTEM INFORMATION
_________________________________________________________________________________________________________
Computer name: DESKTOP-PAG6OF6
OS version: Windows 10 , 10.0, build: 18363 (x64)
Hardware: HP 14 Notebook PC, Hewlett-Packard, 22D0
CPU: AuthenticAMD AMD A4-6210 APU with AMD Radeon R3 Graphics
Logical processors: 4
Processor groups: 1
RAM: 2776 MB total
_________________________________________________________________________________________________________
CPU SPEED
_________________________________________________________________________________________________________
Reported CPU speed: 1797 MHz
Note: reported execution times may be calculated based on a fixed reported CPU speed. Disable variable speed settings like Intel Speed Step and AMD Cool N Quiet in the BIOS setup for more accurate results.
WARNING: the CPU speed that was measured is only a fraction of the CPU speed reported. Your CPUs may be throttled back due to variable speed settings and thermal issues. It is suggested that you run a utility which reports your actual CPU frequency and temperature.
_________________________________________________________________________________________________________
MEASURED INTERRUPT TO USER PROCESS LATENCIES
_________________________________________________________________________________________________________
The interrupt to process latency reflects the measured interval that a usermode process needed to respond to a hardware request from the moment the interrupt service routine started execution. This includes the scheduling and execution of a DPC routine, the signaling of an event and the waking up of a usermode thread from an idle wait state in response to that event.
Highest measured interrupt to process latency (µs): 689,20
Average measured interrupt to process latency (µs): 15,943208
Highest measured interrupt to DPC latency (µs): 665,80
Average measured interrupt to DPC latency (µs): 5,585396
_________________________________________________________________________________________________________
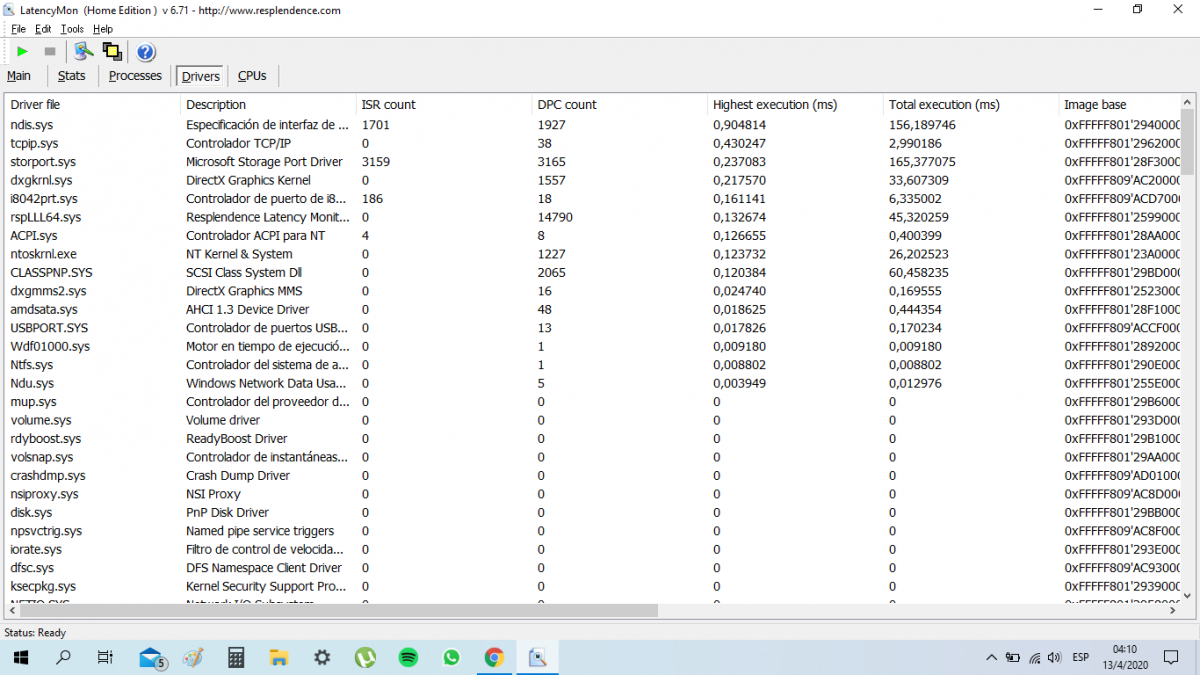
REPORTED ISRs
_________________________________________________________________________________________________________
Interrupt service routines are routines installed by the OS and device drivers that execute in response to a hardware interrupt signal.
Highest ISR routine execution time (µs): 424,934335
Driver with highest ISR routine execution time: ndis.sys - Especificación de interfaz de controlador de red (NDIS), Microsoft Corporation
Highest reported total ISR routine time (%): 0,022631
Driver with highest ISR total time: ndis.sys - Especificación de interfaz de controlador de red (NDIS), Microsoft Corporation
Total time spent in ISRs (%) 0,026997
ISR count (execution time <250 µs): 2033
ISR count (execution time 250-500 µs): 0
ISR count (execution time 500-999 µs): 4
ISR count (execution time 1000-1999 µs): 0
ISR count (execution time 2000-3999 µs): 0
ISR count (execution time >=4000 µs): 0
_________________________________________________________________________________________________________
REPORTED DPCs
_________________________________________________________________________________________________________
DPC routines are part of the interrupt servicing dispatch mechanism and disable the possibility for a process to utilize the CPU while it is interrupted until the DPC has finished execution.
Highest DPC routine execution time (µs): 1225,193656
Driver with highest DPC routine execution time: ndis.sys - Especificación de interfaz de controlador de red (NDIS), Microsoft Corporation
Highest reported total DPC routine time (%): 0,086460
Driver with highest DPC total execution time: dxgkrnl.sys - DirectX Graphics Kernel, Microsoft Corporation
Total time spent in DPCs (%) 0,273485
DPC count (execution time <250 µs): 64397
DPC count (execution time 250-500 µs): 0
DPC count (execution time 500-999 µs): 246
DPC count (execution time 1000-1999 µs): 1
DPC count (execution time 2000-3999 µs): 0
DPC count (execution time >=4000 µs): 0
_________________________________________________________________________________________________________
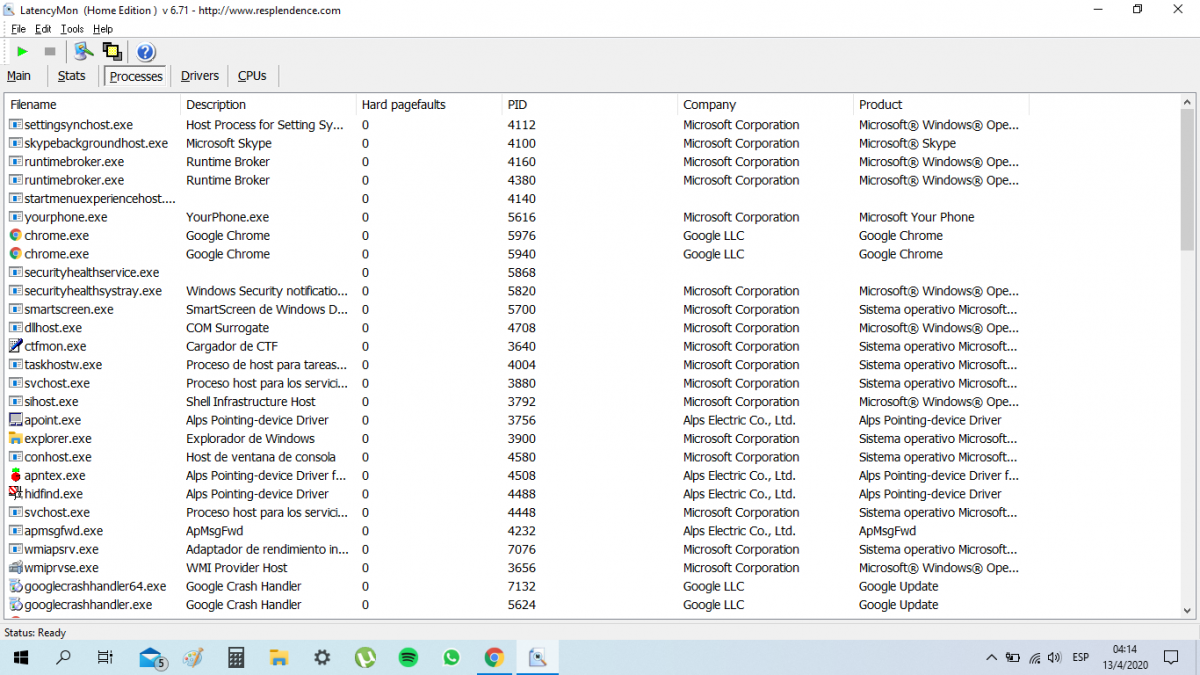
REPORTED HARD PAGEFAULTS
_________________________________________________________________________________________________________
Hard pagefaults are events that get triggered by making use of virtual memory that is not resident in RAM but backed by a memory mapped file on disk. The process of resolving the hard pagefault requires reading in the memory from disk while the process is interrupted and blocked from execution.
NOTE: some processes were hit by hard pagefaults. If these were programs producing audio, they are likely to interrupt the audio stream resulting in dropouts, clicks and pops. Check the Processes tab to see which programs were hit.
Process with highest pagefault count: svchost.exe
Total number of hard pagefaults 59
Hard pagefault count of hardest hit process: 33
Number of processes hit: 12
_________________________________________________________________________________________________________
PER CPU DATA
_________________________________________________________________________________________________________
CPU 0 Interrupt cycle time (s): 2,785799
CPU 0 ISR highest execution time (µs): 424,934335
CPU 0 ISR total execution time (s): 0,080897
CPU 0 ISR count: 1808
CPU 0 DPC highest execution time (µs): 1225,193656
CPU 0 DPC total execution time (s): 0,693888
CPU 0 DPC count: 61154
_________________________________________________________________________________________________________
CPU 1 Interrupt cycle time (s): 2,398226
CPU 1 ISR highest execution time (µs): 47,507513
CPU 1 ISR total execution time (s): 0,000240
CPU 1 ISR count: 24
CPU 1 DPC highest execution time (µs): 528,678353
CPU 1 DPC total execution time (s): 0,132711
CPU 1 DPC count: 2995
_________________________________________________________________________________________________________
CPU 2 Interrupt cycle time (s): 0,877256
CPU 2 ISR highest execution time (µs): 13,490262
CPU 2 ISR total execution time (s): 0,000043
CPU 2 ISR count: 7
CPU 2 DPC highest execution time (µs): 523,008347
CPU 2 DPC total execution time (s): 0,014556
CPU 2 DPC count: 414
_________________________________________________________________________________________________________
CPU 3 Interrupt cycle time (s): 0,422962
CPU 3 ISR highest execution time (µs): 47,481914
CPU 3 ISR total execution time (s): 0,002039
CPU 3 ISR count: 198
CPU 3 DPC highest execution time (µs): 84,943239
CPU 3 DPC total execution time (s): 0,001856
CPU 3 DPC count: 81
_________________________________________________________________________________________________________


![HP desktop - google.com is in Norwegian [Solved] - last post by wayneman50](https://www.geekstogo.com/forum/uploads/profile/photo-thumb-328601.jpg?_r=1546827512)


 Sign In
 Create Account
