_________________________________________________________________________________________________________
CONCLUSION
_________________________________________________________________________________________________________
Your system appears to be suitable for handling real-time audio and other tasks without dropouts.
LatencyMon has been analyzing your system for 0:01:05 (h:mm:ss) on all processors.
_________________________________________________________________________________________________________
SYSTEM INFORMATION
_________________________________________________________________________________________________________
Computer name: AT
OS version: Windows 10 , 10.0, build: 19041 (x64)
Hardware: ASRock, H110M-HDV
CPU: GenuineIntel Intel® Core™ i3-6100 CPU @ 3.70GHz
Logical processors: 4
Processor groups: 1
RAM: 8154 MB total
_________________________________________________________________________________________________________
CPU SPEED
_________________________________________________________________________________________________________
Reported CPU speed: 3696 MHz
Note: reported execution times may be calculated based on a fixed reported CPU speed. Disable variable speed settings like Intel Speed Step and AMD Cool N Quiet in the BIOS setup for more accurate results.
WARNING: the CPU speed that was measured is only a fraction of the CPU speed reported. Your CPUs may be throttled back due to variable speed settings and thermal issues. It is suggested that you run a utility which reports your actual CPU frequency and temperature.
_________________________________________________________________________________________________________
MEASURED INTERRUPT TO USER PROCESS LATENCIES
_________________________________________________________________________________________________________
The interrupt to process latency reflects the measured interval that a usermode process needed to respond to a hardware request from the moment the interrupt service routine started execution. This includes the scheduling and execution of a DPC routine, the signaling of an event and the waking up of a usermode thread from an idle wait state in response to that event.
Highest measured interrupt to process latency (µs): 455.50
Average measured interrupt to process latency (µs): 3.525627
Highest measured interrupt to DPC latency (µs): 425.80
Average measured interrupt to DPC latency (µs): 0.896156
_________________________________________________________________________________________________________
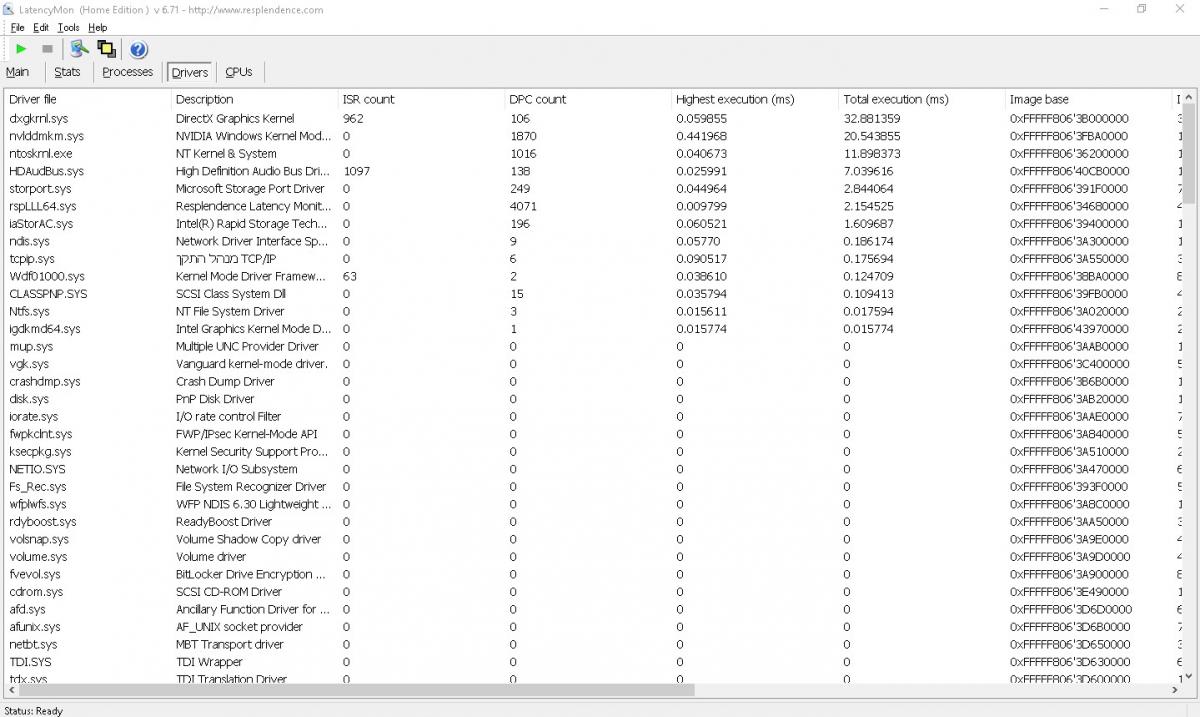
REPORTED ISRs
_________________________________________________________________________________________________________
Interrupt service routines are routines installed by the OS and device drivers that execute in response to a hardware interrupt signal.
Highest ISR routine execution time (µs): 88.579545
Driver with highest ISR routine execution time: dxgkrnl.sys - DirectX Graphics Kernel, Microsoft Corporation
Highest reported total ISR routine time (%): 0.036881
Driver with highest ISR total time: dxgkrnl.sys - DirectX Graphics Kernel, Microsoft Corporation
Total time spent in ISRs (%) 0.044884
ISR count (execution time <250 µs): 6508
ISR count (execution time 250-500 µs): 0
ISR count (execution time 500-999 µs): 0
ISR count (execution time 1000-1999 µs): 0
ISR count (execution time 2000-3999 µs): 0
ISR count (execution time >=4000 µs): 0
_________________________________________________________________________________________________________
REPORTED DPCs
_________________________________________________________________________________________________________
DPC routines are part of the interrupt servicing dispatch mechanism and disable the possibility for a process to utilize the CPU while it is interrupted until the DPC has finished execution.
Highest DPC routine execution time (µs): 455.042749
Driver with highest DPC routine execution time: nvlddmkm.sys - NVIDIA Windows Kernel Mode Driver, Version 391.35 , NVIDIA Corporation
Highest reported total DPC routine time (%): 0.052988
Driver with highest DPC total execution time: iaStorAC.sys - Intel® Rapid Storage Technology driver - x64, Intel Corporation
Total time spent in DPCs (%) 0.158884
DPC count (execution time <250 µs): 59152
DPC count (execution time 250-500 µs): 0
DPC count (execution time 500-999 µs): 29
DPC count (execution time 1000-1999 µs): 0
DPC count (execution time 2000-3999 µs): 0
DPC count (execution time >=4000 µs): 0
_________________________________________________________________________________________________________
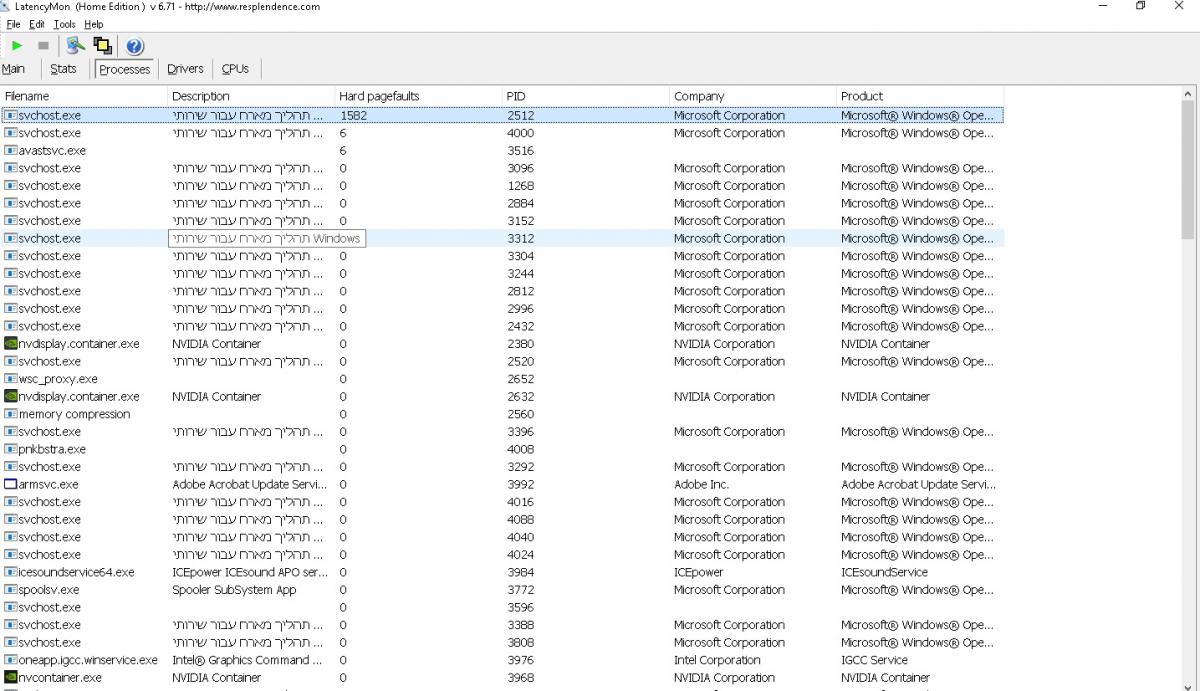
REPORTED HARD PAGEFAULTS
_________________________________________________________________________________________________________
Hard pagefaults are events that get triggered by making use of virtual memory that is not resident in RAM but backed by a memory mapped file on disk. The process of resolving the hard pagefault requires reading in the memory from disk while the process is interrupted and blocked from execution.
NOTE: some processes were hit by hard pagefaults. If these were programs producing audio, they are likely to interrupt the audio stream resulting in dropouts, clicks and pops. Check the Processes tab to see which programs were hit.
Process with highest pagefault count: svchost.exe
Total number of hard pagefaults 1594
Hard pagefault count of hardest hit process: 1582
Number of processes hit: 3
_________________________________________________________________________________________________________
PER CPU DATA
_________________________________________________________________________________________________________
CPU 0 Interrupt cycle time (s): 0.978804
CPU 0 ISR highest execution time (µs): 88.579545
CPU 0 ISR total execution time (s): 0.117080
CPU 0 ISR count: 6301
CPU 0 DPC highest execution time (µs): 455.042749
CPU 0 DPC total execution time (s): 0.285429
CPU 0 DPC count: 45715
_________________________________________________________________________________________________________
CPU 1 Interrupt cycle time (s): 0.131786
CPU 1 ISR highest execution time (µs): 13.642316
CPU 1 ISR total execution time (s): 0.000181
CPU 1 ISR count: 207
CPU 1 DPC highest execution time (µs): 48.181277
CPU 1 DPC total execution time (s): 0.001832
CPU 1 DPC count: 391
_________________________________________________________________________________________________________
CPU 2 Interrupt cycle time (s): 0.251536
CPU 2 ISR highest execution time (µs): 0.0
CPU 2 ISR total execution time (s): 0.0
CPU 2 ISR count: 0
CPU 2 DPC highest execution time (µs): 150.535714
CPU 2 DPC total execution time (s): 0.120864
CPU 2 DPC count: 12153
_________________________________________________________________________________________________________
CPU 3 Interrupt cycle time (s): 0.143207
CPU 3 ISR highest execution time (µs): 0.0
CPU 3 ISR total execution time (s): 0.0
CPU 3 ISR count: 0
CPU 3 DPC highest execution time (µs): 154.863095
CPU 3 DPC total execution time (s): 0.006963
CPU 3 DPC count: 922
_________________________________________________________________________________________________________


 ,I heard its a bit dangerous,but im counting on you,also I take alot of safety steps with this.


 Sign In
 Create Account
