Jump to content

Welcome to Geeks to Go - Register now for FREE

Need help with your computer or device? Want to learn new tech skills? You're in the right place!
Geeks to Go is a friendly community of tech experts who can solve any problem you have. Just create a free account and post your question. Our volunteers will reply quickly and guide you through the steps. Don't let tech troubles stop you. Join Geeks to Go now and get the support you need!

How it Works Create Account
Photo

Telegram Desktop converts a paste into an attachment


  • Please log in to reply

#106
RKinner

RKinner

    Malware Expert

  • Expert
  • 24,625 posts
  • MVP

Apparently there is a big difference between SSDs.  Makes me glad I spent the extra money to get the EVO.     I don't see any drop outs tho. 


If you are still getting the  errors about C:\Users\Joe\AppData\Local\Microsoft\Windows Live Mail\edbtmp.log you might close Windows Live,

Open an Elevated Command Prompt and type:

esentutl  /p  "C:\Users\Joe\AppData\Local\Microsoft\Windows Live Mail\edbtmp.log"

Then hit Enter.  Sometimes esentutl will decide it can fix a file and help us out.


I see you are also getting similar errors for other files.  Somehow I thought they were the same files but I see they are not.  Try

running esentutl /p on each file listed with the same Event: 508 error.  Do any of them say they were able to fix the file?

You usually have to stop the process that is using the file.  I think Webcache is associated with having a browser open.


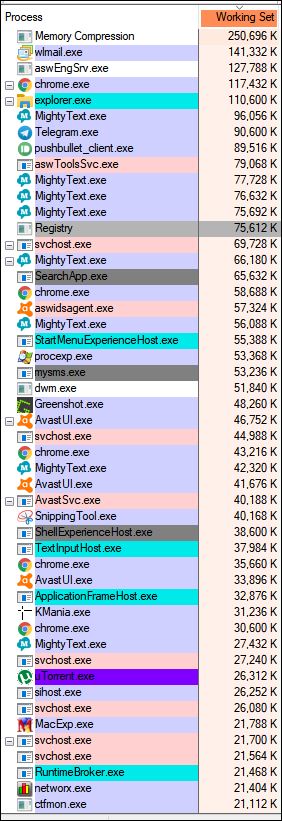
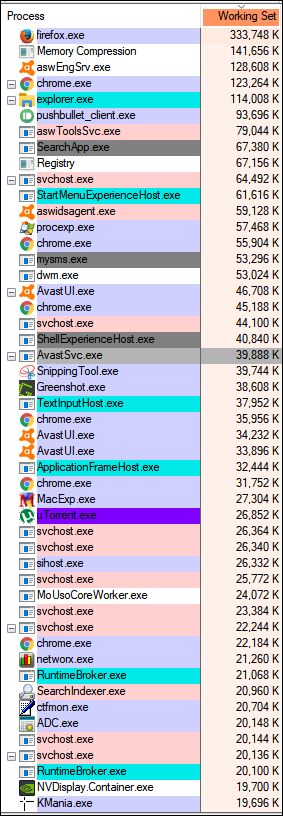
These errors can be caused by low available RAM so I wish you would try running Latency Monitor.

Go to

http://www.resplendence.com/downloads

Scroll down to

System Monitoring Tools

and then find

LatencyMon 6.70 (or it may be a higher number if they update)

Click on Download free home edition

Save it then right click and Run As Admin.  It will install and then start the program.  
It will tell you to click on the Start button but there isn't one.  
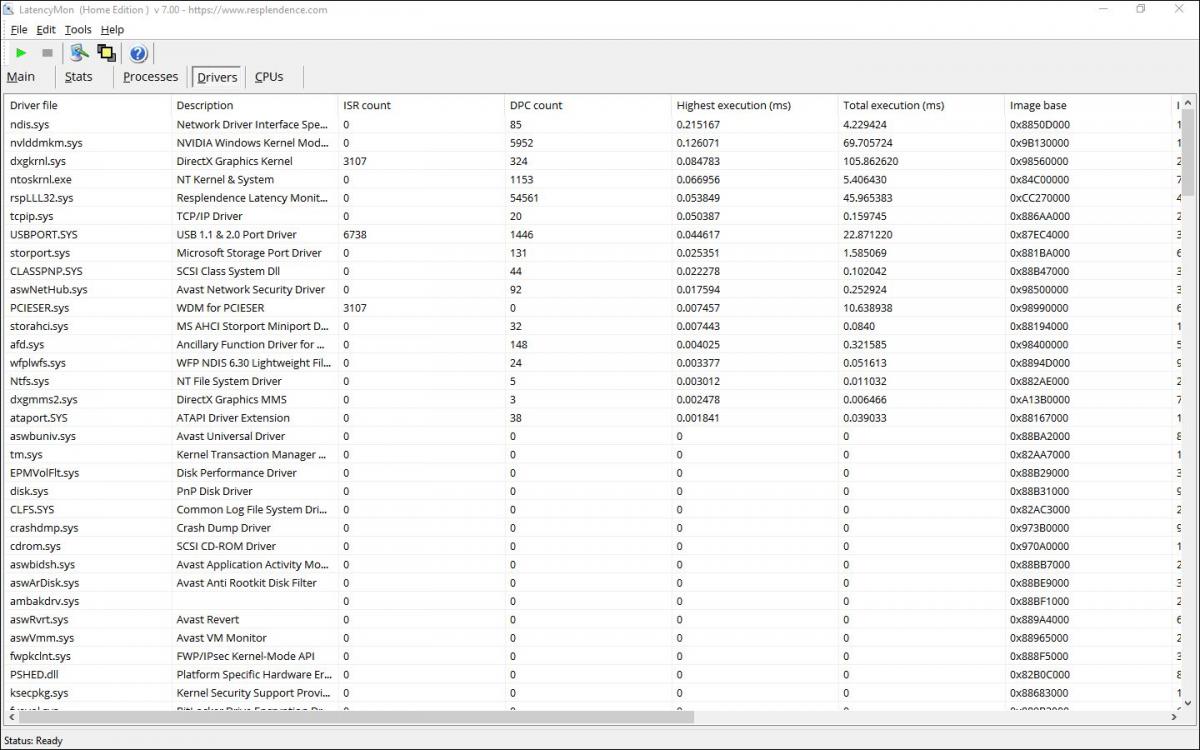
Instead click on the green arrowhead (looks like a Play button).   Let it run for at least 20 seconds.  Then hit the red box to stop it.

Edit, Copy Report text to Clipboard then move to a REPLY and Ctrl + v to paste the text into a reply.  


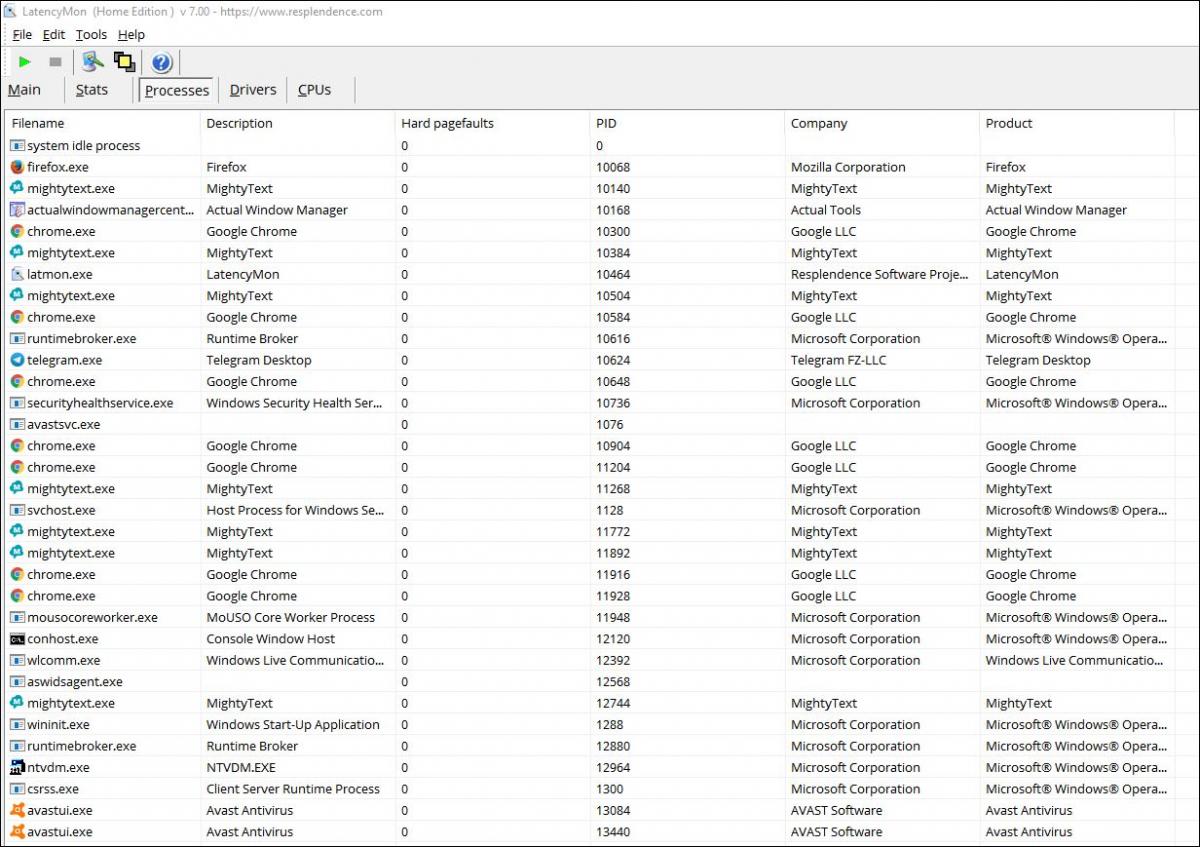
Click on the Drivers Tab.  Click on the column header for "Total execution (ms)" once or twice until the biggest numbers are at the top then take a screen shot and post it.  Click on the Processes tab then click on the column header once or twice until the big numbers are at the top.  Take a screen shot and post it.


  • 0

Advertisements


#107
Basty

Basty

    Member

  • Topic Starter
  • Member
  • PipPipPip
  • 220 posts

"still getting the  errors about C:\Users\Joe\AppData\Local\Microsoft\Windows Live Mail\edbtmp.log"

I have not complained about WLM at all (although I could if I put my mind to it), so you'll have to clarify 'getting errors'.


I will do Latency and report on it as soon as I can.


Although the mobo has slots for more RAM and I actually HAVE more RAM, Windows says there is already more in the 4Gb than it can use (because it is a 32bit system).


Should it be useful, I do have (but do not routinely USE) an SSD with a viable x64Win10ProV20H2 that runs in this PC - it will tolerate all the RAM I have.


  • 0

#108
RKinner

RKinner

    Malware Expert

  • Expert
  • 24,625 posts
  • MVP

Look in VEWapp.txt and you will see a lot of 508 errors.


Look at the date and times to see if they are recent errors.


  • 0

#109
Basty

Basty

    Member

  • Topic Starter
  • Member
  • PipPipPip
  • 220 posts

I looked at the text files I included in post 99. The one for apps had '508' errors in Mail on Tuesday morning. I don't recall any difficulties with mail that day


  • 0

#110
Basty

Basty

    Member

  • Topic Starter
  • Member
  • PipPipPip
  • 220 posts

I ran the esentutl on the first '508' error listed :


Attached Thumbnails

  • esentutl.JPG

  • 0

#111
Basty

Basty

    Member

  • Topic Starter
  • Member
  • PipPipPip
  • 220 posts

Latency monitor :

_________________________________________________________________________________________________________
CONCLUSION
_________________________________________________________________________________________________________
Your system appears to be suitable for handling real-time audio and other tasks without dropouts.
LatencyMon has been analyzing your system for  0:00:25  (h:mm:ss) on all processors.


_________________________________________________________________________________________________________
SYSTEM INFORMATION
_________________________________________________________________________________________________________
Computer name:                                        DESKTOPTOWER
OS version:                                           Windows 10, 10.0, version 2009, build: 19042 (x86)
Hardware:                                             X58A-UD5, Gigabyte Technology Co., Ltd.
CPU:                                                  GenuineIntel Intel® Core™ i7 CPU X 990 @ 3.47GHz
Logical processors:                                   12
Processor groups:                                     1
RAM:                                                  3582 MB total


_________________________________________________________________________________________________________
CPU SPEED
_________________________________________________________________________________________________________
Reported CPU speed:                                   3464 MHz

Note: reported execution times may be calculated based on a fixed reported CPU speed. Disable variable speed settings like Intel Speed Step and AMD Cool N Quiet in the BIOS setup for more accurate results.


_________________________________________________________________________________________________________
MEASURED INTERRUPT TO USER PROCESS LATENCIES
_________________________________________________________________________________________________________
The interrupt to process latency reflects the measured interval that a usermode process needed to respond to a hardware request from the moment the interrupt service routine started execution. This includes the scheduling and execution of a DPC routine, the signaling of an event and the waking up of a usermode thread from an idle wait state in response to that event.

Highest measured interrupt to process latency (µs):   110.80
Average measured interrupt to process latency (µs):   5.896226

Highest measured interrupt to DPC latency (µs):       106.10
Average measured interrupt to DPC latency (µs):       3.034502


_________________________________________________________________________________________________________
 REPORTED ISRs
_________________________________________________________________________________________________________
Interrupt service routines are routines installed by the OS and device drivers that execute in response to a hardware interrupt signal.

Highest ISR routine execution time (µs):              75.274827
Driver with highest ISR routine execution time:       dxgkrnl.sys - DirectX Graphics Kernel, Microsoft Corporation

Highest reported total ISR routine time (%):          0.03340
Driver with highest ISR total time:                   dxgkrnl.sys - DirectX Graphics Kernel, Microsoft Corporation

Total time spent in ISRs (%)                          0.041884

ISR count (execution time <250 µs):                   12952
ISR count (execution time 250-500 µs):                0
ISR count (execution time 500-1000 µs):               0
ISR count (execution time 1000-2000 µs):              0
ISR count (execution time 2000-4000 µs):              0
ISR count (execution time >=4000 µs):                 0


_________________________________________________________________________________________________________
REPORTED DPCs
_________________________________________________________________________________________________________
DPC routines are part of the interrupt servicing dispatch mechanism and disable the possibility for a process to utilize the CPU while it is interrupted until the DPC has finished execution.

Highest DPC routine execution time (µs):              215.167436
Driver with highest DPC routine execution time:       ndis.sys - Network Driver Interface Specification (NDIS), Microsoft Corporation

Highest reported total DPC routine time (%):          0.021217
Driver with highest DPC total execution time:         nvlddmkm.sys - NVIDIA Windows Kernel Mode Driver, Version 391.35 , NVIDIA Corporation

Total time spent in DPCs (%)                          0.047157

DPC count (execution time <250 µs):                   64058
DPC count (execution time 250-500 µs):                0
DPC count (execution time 500-10000 µs):              0
DPC count (execution time 1000-2000 µs):              0
DPC count (execution time 2000-4000 µs):              0
DPC count (execution time >=4000 µs):                 0


_________________________________________________________________________________________________________
 REPORTED HARD PAGEFAULTS
_________________________________________________________________________________________________________
Hard pagefaults are events that get triggered by making use of virtual memory that is not resident in RAM but backed by a memory mapped file on disk. The process of resolving the hard pagefault requires reading in the memory from disk while the process is interrupted and blocked from execution.


Process with highest pagefault count:                 none

Total number of hard pagefaults                       0
Hard pagefault count of hardest hit process:          0
Number of processes hit:                              0


_________________________________________________________________________________________________________
 PER CPU DATA
_________________________________________________________________________________________________________
CPU 0 Interrupt cycle time (s):                       0.498470
CPU 0 ISR highest execution time (µs):                75.274827
CPU 0 ISR total execution time (s):                   0.125732
CPU 0 ISR count:                                      12952
CPU 0 DPC highest execution time (µs):                215.167436
CPU 0 DPC total execution time (s):                   0.140418
CPU 0 DPC count:                                      63806
_________________________________________________________________________________________________________
CPU 1 Interrupt cycle time (s):                       0.122454
CPU 1 ISR highest execution time (µs):                0.0
CPU 1 ISR total execution time (s):                   0.0
CPU 1 ISR count:                                      0
CPU 1 DPC highest execution time (µs):                153.346420
CPU 1 DPC total execution time (s):                   0.000485
CPU 1 DPC count:                                      90
_________________________________________________________________________________________________________
CPU 2 Interrupt cycle time (s):                       0.107197
CPU 2 ISR highest execution time (µs):                0.0
CPU 2 ISR total execution time (s):                   0.0
CPU 2 ISR count:                                      0
CPU 2 DPC highest execution time (µs):                20.847864
CPU 2 DPC total execution time (s):                   0.000122
CPU 2 DPC count:                                      40
_________________________________________________________________________________________________________
CPU 3 Interrupt cycle time (s):                       0.108780
CPU 3 ISR highest execution time (µs):                0.0
CPU 3 ISR total execution time (s):                   0.0
CPU 3 ISR count:                                      0
CPU 3 DPC highest execution time (µs):                126.648672
CPU 3 DPC total execution time (s):                   0.000431
CPU 3 DPC count:                                      91
_________________________________________________________________________________________________________
CPU 4 Interrupt cycle time (s):                       0.095420
CPU 4 ISR highest execution time (µs):                0.0
CPU 4 ISR total execution time (s):                   0.0
CPU 4 ISR count:                                      0
CPU 4 DPC highest execution time (µs):                25.160219
CPU 4 DPC total execution time (s):                   0.000068
CPU 4 DPC count:                                      18
_________________________________________________________________________________________________________
CPU 5 Interrupt cycle time (s):                       0.091292
CPU 5 ISR highest execution time (µs):                0.0
CPU 5 ISR total execution time (s):                   0.0
CPU 5 ISR count:                                      0
CPU 5 DPC highest execution time (µs):                2.242206
CPU 5 DPC total execution time (s):                   0.000007
CPU 5 DPC count:                                      5
_________________________________________________________________________________________________________
CPU 6 Interrupt cycle time (s):                       0.095075
CPU 6 ISR highest execution time (µs):                0.0
CPU 6 ISR total execution time (s):                   0.0
CPU 6 ISR count:                                      0
CPU 6 DPC highest execution time (µs):                0.0
CPU 6 DPC total execution time (s):                   0.0
CPU 6 DPC count:                                      0
_________________________________________________________________________________________________________
CPU 7 Interrupt cycle time (s):                       0.098489
CPU 7 ISR highest execution time (µs):                0.0
CPU 7 ISR total execution time (s):                   0.0
CPU 7 ISR count:                                      0
CPU 7 DPC highest execution time (µs):                0.0
CPU 7 DPC total execution time (s):                   0.0
CPU 7 DPC count:                                      0
_________________________________________________________________________________________________________
CPU 8 Interrupt cycle time (s):                       0.094595
CPU 8 ISR highest execution time (µs):                0.0
CPU 8 ISR total execution time (s):                   0.0
CPU 8 ISR count:                                      0
CPU 8 DPC highest execution time (µs):                0.0
CPU 8 DPC total execution time (s):                   0.0
CPU 8 DPC count:                                      0
_________________________________________________________________________________________________________
CPU 9 Interrupt cycle time (s):                       0.107142
CPU 9 ISR highest execution time (µs):                0.0
CPU 9 ISR total execution time (s):                   0.0
CPU 9 ISR count:                                      0
CPU 9 DPC highest execution time (µs):                0.0
CPU 9 DPC total execution time (s):                   0.0
CPU 9 DPC count:                                      0
_________________________________________________________________________________________________________
CPU 10 Interrupt cycle time (s):                       0.102819
CPU 10 ISR highest execution time (µs):                0.0
CPU 10 ISR total execution time (s):                   0.0
CPU 10 ISR count:                                      0
CPU 10 DPC highest execution time (µs):                0.0
CPU 10 DPC total execution time (s):                   0.0
CPU 10 DPC count:                                      0
_________________________________________________________________________________________________________
CPU 11 Interrupt cycle time (s):                       0.101930
CPU 11 ISR highest execution time (µs):                0.0
CPU 11 ISR total execution time (s):                   0.0
CPU 11 ISR count:                                      0
CPU 11 DPC highest execution time (µs):                12.708430
CPU 11 DPC total execution time (s):                   0.000031
CPU 11 DPC count:                                      8
_________________________________________________________________________________________________________


  • 0

#112
Basty

Basty

    Member

  • Topic Starter
  • Member
  • PipPipPip
  • 220 posts

Latency II (closed it before I saw there was a part III)

Attached Thumbnails

  • Latency.JPG

  • 0

#113
Basty

Basty

    Member

  • Topic Starter
  • Member
  • PipPipPip
  • 220 posts

"Click on the Processes tab then click on the column header once or twice until the big numbers are at the top.  Take a screen shot and post it."

The only column with numbers are 1. hard page faults - they are all '0' and 2. PID which do not sort well


I mistakenly posted it before attaching the screenshot - and cannot edit this to add the shot, so in the next post.


Edited by Basty, 10 March 2021 - 02:37 AM.

  • 0

#114
Basty

Basty

    Member

  • Topic Starter
  • Member
  • PipPipPip
  • 220 posts

Here is the forgotten attachment

Attached Thumbnails

  • LatencyIII.JPG

  • 0

#115
Basty

Basty

    Member

  • Topic Starter
  • Member
  • PipPipPip
  • 220 posts

For what it is worth, got the following message today "You may experience slow performance with BlueStacks due to the low available RAM. Please consider closing some programs and continue."


Because of their individual unreliability I now have four SMS monitoring programs on this PC [Mightyext, SendLeap; MySMS and PushBullet] - THAT may be loading the RAM too much; If they worked perfectly, ONE would do, but I have the four to ensure I do not miss any SMSs.

At nearly 80 - I have a difficulty with, and so a distaste for, mobile phones, so have found ways to do SMS from the PC.


  • 0

Advertisements


#116
RKinner

RKinner

    Malware Expert

  • Expert
  • 24,625 posts
  • MVP

Might be a memory leak in one of your programs.  If you do a Process Explorer  (sorted by Working Set) you should be able to see what is using the memory when you have all four open.  Leave it running and see if the biggest user keeps getting bigger over time.


You said you had an SSD with a 64 bit version of Win 10 you could put in.  Is there a reason you prefer the 32 bit version?  Probably be worth trying the 64.  Would rule out a Windows problem and a problem with the C: drive.


Also since you found a bad connection on a Y-splitter for your power supply perhaps you might replace all of your splitters.  They aren't that expensive.  Either that or get a power supply with enough connections so you don't need splitters. 


As far as SMS goes, I've always used Google Voice to send and receive text.  Seems to work reliably but probably not what you want since they assign you a number and don't sync with your current number.


(I'm 75 and don't own a smart phone.  Too deaf to hear what the party on the other end is saying.)


  • 0

#117
Basty

Basty

    Member

  • Topic Starter
  • Member
  • PipPipPip
  • 220 posts

Turns out I am your SENIOR (in age) !


Will do Process Explorer (with all four 'chat' programs open) in due course  (and report back on the results).


'Is there a reason you prefer the 32 bit version?'

YES, it contains all the programs and their tweaks that I accumulated over many years - especially bought programs, that I would have to re-buy if I went to x64.

I have yet to find a cogent reason for GOING TO THE TROUBLE of changing to x64.


'or get a power supply with enough connections so you don't need splitters'

A NEW power supply rated at 800W instead of 775W, is on its way to me. I wont know what its connectors are till I see them - but they ARE newer.


'Too deaf to hear what the party on the other end is saying' that is ONE of my reasons for stipulating that if any caller wants to SPEAK to me, they'll have to call my landline.

I have a list of other objections to mobile phones which there is no reason for me to expand on in this thread.


By the way - another guru told me to try the 5Tb in this PC and the 64bit one but in Safe Mode - no CONSISTENT improvement.


  • 0

#118
Basty

Basty

    Member

  • Topic Starter
  • Member
  • PipPipPip
  • 220 posts

All four CP-to-PC programs are running; THIS PC showed empty - not responding. 

Attached Thumbnails

  • ProcExp.JPG

  • 0

#119
RKinner

RKinner

    Malware Expert

  • Expert
  • 24,625 posts
  • MVP

Did you leave it running to see if the amount of memory used increase over time?


Mighty Text seems to use a lot of memory with so many instances.  Can you close it and try again? 


  • 0

#120
Basty

Basty

    Member

  • Topic Starter
  • Member
  • PipPipPip
  • 220 posts

I apologise - did not leave it running.  If I do let it run - for how long and do I send you another snip afterwards.


For what it is worth, MightyText run out of FREE use by the 20 of the month, and then I don't launch it again until the 1st of the next month. Each of those four programs have different features that make them worth ALSO running - but not at ANY cost. If you can pinpoint Mighty Text or another as the source of my THIS PC problems, I would consider abandoning it.


I'm attaching a similar snapshot with MightyTExt closed down.


Firefox is at the top - but it has ONLY THIS thread open. It is an old version (v50) but has an advantage that newer ones don't have;  and where it is not suitable i just use an uptodate Chrome (or Edge). The ProcEx results are VERY stable now, but THIS PC fails!


Attached Thumbnails

  • ProcEx.JPG

  • 0


Similar Topics

0 user(s) are reading this topic

0 members, 0 guests, 0 anonymous users

As Featured On:

Microsoft Yahoo BBC MSN PC Magazine Washington Post HP