Jump to content

Welcome to Geeks to Go - Register now for FREE

Need help with your computer or device? Want to learn new tech skills? You're in the right place!
Geeks to Go is a friendly community of tech experts who can solve any problem you have. Just create a free account and post your question. Our volunteers will reply quickly and guide you through the steps. Don't let tech troubles stop you. Join Geeks to Go now and get the support you need!

How it Works Create Account
Photo

Disk Usage 100%


  • Please log in to reply

#31
RKinner

RKinner

    Malware Expert

  • Expert
  • 24,624 posts
  • MVP
download ShellExView.
 
 
Use this download:
Save, go to the Download folder and right click on the file and Run as Admin
Once you get it installed, run it and look in the third or fourth column from the RIGHT. It should say MICROSOFT. Click once or twice on MICROSOFT so that items with NO are at the top.
Select all of the NO items and then click on the red led looking icon in the upper left. This should disable all of the non-microsoft additions to Explorer.  (You may not be able to disable any McAfee additions if so don't worry about them)   Reboot and rerun Latency Monitor as you just did.

  • 0

Advertisements


#32
ttbcs

ttbcs

    Member

  • Topic Starter
  • Member
  • PipPipPip
  • 102 posts

_________________________________________________________________________________________________________
CONCLUSION
_________________________________________________________________________________________________________
Your system appears to be suitable for handling real-time audio and other tasks without dropouts.
LatencyMon has been analyzing your system for  0:00:59  (h:mm:ss) on all processors.


_________________________________________________________________________________________________________
SYSTEM INFORMATION
_________________________________________________________________________________________________________
Computer name:                                        LAPTOP-TRAVIS
OS version:                                           Windows 11, 10.0, version 2009, build: 22000 (x64)
Hardware:                                             HP Pavilion Laptop 15-ck0xx, HP
BIOS:                                                 F.15
CPU:                                                  GenuineIntel Intel® Core™ i5-8250U CPU @ 1.60GHz
Logical processors:                                   8
Processor groups:                                     1
Processor group size:                                 8
RAM:                                                  8078 MB total


_________________________________________________________________________________________________________
CPU SPEED
_________________________________________________________________________________________________________
Reported CPU speed (WMI):                             160 MHz
Reported CPU speed (registry):                        180 MHz

Note: reported execution times may be calculated based on a fixed reported CPU speed. Disable variable speed settings like Intel Speed Step and AMD Cool N Quiet in the BIOS setup for more accurate results.


_________________________________________________________________________________________________________
MEASURED INTERRUPT TO USER PROCESS LATENCIES
_________________________________________________________________________________________________________
The interrupt to process latency reflects the measured interval that a usermode process needed to respond to a hardware request from the moment the interrupt service routine started execution. This includes the scheduling and execution of a DPC routine, the signaling of an event and the waking up of a usermode thread from an idle wait state in response to that event.

Highest measured interrupt to process latency (µs):   479.70
Average measured interrupt to process latency (µs):   9.917090

Highest measured interrupt to DPC latency (µs):       444.60
Average measured interrupt to DPC latency (µs):       3.065194


_________________________________________________________________________________________________________
 REPORTED ISRs
_________________________________________________________________________________________________________
Interrupt service routines are routines installed by the OS and device drivers that execute in response to a hardware interrupt signal.

Highest ISR routine execution time (µs):              89.456111
Driver with highest ISR routine execution time:       ACPI.sys - ACPI Driver for NT, Microsoft Corporation

Highest reported total ISR routine time (%):          0.001338
Driver with highest ISR total time:                   ACPI.sys - ACPI Driver for NT, Microsoft Corporation

Total time spent in ISRs (%)                          0.001372

ISR count (execution time <250 µs):                   168
ISR count (execution time 250-500 µs):                0
ISR count (execution time 500-1000 µs):               0
ISR count (execution time 1000-2000 µs):              0
ISR count (execution time 2000-4000 µs):              0
ISR count (execution time >=4000 µs):                 0


_________________________________________________________________________________________________________
REPORTED DPCs
_________________________________________________________________________________________________________
DPC routines are part of the interrupt servicing dispatch mechanism and disable the possibility for a process to utilize the CPU while it is interrupted until the DPC has finished execution.

Highest DPC routine execution time (µs):              609.050556
Driver with highest DPC routine execution time:       ACPI.sys - ACPI Driver for NT, Microsoft Corporation

Highest reported total DPC routine time (%):          0.014245
Driver with highest DPC total execution time:         rspLLL64.sys - Resplendence Latency Monitoring and Auxiliary Kernel Library, Resplendence Software Projects Sp.

Total time spent in DPCs (%)                          0.030959

DPC count (execution time <250 µs):                   22747
DPC count (execution time 250-500 µs):                0
DPC count (execution time 500-10000 µs):              36
DPC count (execution time 1000-2000 µs):              0
DPC count (execution time 2000-4000 µs):              0
DPC count (execution time >=4000 µs):                 0


_________________________________________________________________________________________________________
 REPORTED HARD PAGEFAULTS
_________________________________________________________________________________________________________
Hard pagefaults are events that get triggered by making use of virtual memory that is not resident in RAM but backed by a memory mapped file on disk. The process of resolving the hard pagefault requires reading in the memory from disk while the process is interrupted and blocked from execution.

NOTE: some processes were hit by hard pagefaults. If these were programs producing audio, they are likely to interrupt the audio stream resulting in dropouts, clicks and pops. Check the Processes tab to see which programs were hit.

Process with highest pagefault count:                 latmon.exe

Total number of hard pagefaults                       2
Hard pagefault count of hardest hit process:          1
Number of processes hit:                              2


_________________________________________________________________________________________________________
 PER CPU DATA
_________________________________________________________________________________________________________
CPU 0 Interrupt cycle time (s):                       0.437738
CPU 0 ISR highest execution time (µs):                89.456111
CPU 0 ISR total execution time (s):                   0.006509
CPU 0 ISR count:                                      168
CPU 0 DPC highest execution time (µs):                609.050556
CPU 0 DPC total execution time (s):                   0.136562
CPU 0 DPC count:                                      22176
_________________________________________________________________________________________________________
CPU 1 Interrupt cycle time (s):                       0.141821
CPU 1 ISR highest execution time (µs):                0.0
CPU 1 ISR total execution time (s):                   0.0
CPU 1 ISR count:                                      0
CPU 1 DPC highest execution time (µs):                0.0
CPU 1 DPC total execution time (s):                   0.0
CPU 1 DPC count:                                      0
_________________________________________________________________________________________________________
CPU 2 Interrupt cycle time (s):                       0.320611
CPU 2 ISR highest execution time (µs):                0.0
CPU 2 ISR total execution time (s):                   0.0
CPU 2 ISR count:                                      0
CPU 2 DPC highest execution time (µs):                8.281667
CPU 2 DPC total execution time (s):                   0.000060
CPU 2 DPC count:                                      17
_________________________________________________________________________________________________________
CPU 3 Interrupt cycle time (s):                       0.293462
CPU 3 ISR highest execution time (µs):                0.0
CPU 3 ISR total execution time (s):                   0.0
CPU 3 ISR count:                                      0
CPU 3 DPC highest execution time (µs):                396.297222
CPU 3 DPC total execution time (s):                   0.000869
CPU 3 DPC count:                                      22
_________________________________________________________________________________________________________
CPU 4 Interrupt cycle time (s):                       1.257194
CPU 4 ISR highest execution time (µs):                0.0
CPU 4 ISR total execution time (s):                   0.0
CPU 4 ISR count:                                      0
CPU 4 DPC highest execution time (µs):                9.232778
CPU 4 DPC total execution time (s):                   0.000032
CPU 4 DPC count:                                      8
_________________________________________________________________________________________________________
CPU 5 Interrupt cycle time (s):                       0.779195
CPU 5 ISR highest execution time (µs):                0.0
CPU 5 ISR total execution time (s):                   0.0
CPU 5 ISR count:                                      0
CPU 5 DPC highest execution time (µs):                137.209444
CPU 5 DPC total execution time (s):                   0.008797
CPU 5 DPC count:                                      506
_________________________________________________________________________________________________________
CPU 6 Interrupt cycle time (s):                       0.164133
CPU 6 ISR highest execution time (µs):                0.0
CPU 6 ISR total execution time (s):                   0.0
CPU 6 ISR count:                                      0
CPU 6 DPC highest execution time (µs):                0.0
CPU 6 DPC total execution time (s):                   0.0
CPU 6 DPC count:                                      0
_________________________________________________________________________________________________________
CPU 7 Interrupt cycle time (s):                       0.146830
CPU 7 ISR highest execution time (µs):                0.0
CPU 7 ISR total execution time (s):                   0.0
CPU 7 ISR count:                                      0
CPU 7 DPC highest execution time (µs):                52.4350
CPU 7 DPC total execution time (s):                   0.000501
CPU 7 DPC count:                                      54
_________________________________________________________________________________________________________


Attached Thumbnails

  • Processes Screenshot 2022-07-08 172001.jpg

  • 0

#33
RKinner

RKinner

    Malware Expert

  • Expert
  • 24,624 posts
  • MVP

That looks better.  Was your browser running?


Can you do a screenshot of ShellExView so I can see what got disabled?


  • 0

#34
ttbcs

ttbcs

    Member

  • Topic Starter
  • Member
  • PipPipPip
  • 102 posts

The browser was not running when I ran Latency Monitor.

Attached Thumbnails

  • Shell Screenshot 2022-07-09 055627.jpg

  • 0

#35
RKinner

RKinner

    Malware Expert

  • Expert
  • 24,624 posts
  • MVP

I have the first three on my PC so they are probably OK.

Expect ANotepad++64 is OK too.  

HP Network Check Helper should have been removed when we uninstalled the HP Support stuff.  Possible problem child.

Then we have two McAfee entries.  Don't use McAfee (and don't really like the program either) so can't say.

PDF Preview Handler is suspicious.  No name attached.

Synaptics Control panel is probably from your touch pad and probably benign.

The last two are known to slow things down and the recommendation is to remove them:


https://www.guidingt...k-context-menu/


I'd reenable the top three and the two McAfees and the Synaptics entries and then either reboot or just restart Explorer and then rerun Latency Monitor and see if it is still happy.


I suppose we also need to try Latency Monitor with your Browser running to see what it looks like then.


  • 0

#36
ttbcs

ttbcs

    Member

  • Topic Starter
  • Member
  • PipPipPip
  • 102 posts

So I enabled the ones you mentioned, image attached, and got the following. I ran Latency Monitor right after reboot.


_________________________________________________________________________________________________________
CONCLUSION
_________________________________________________________________________________________________________
Your system appears to be having trouble handling real-time audio and other tasks. You are likely to experience buffer underruns appearing as drop outs, clicks or pops. One or more DPC routines that belong to a driver running in your system appear to be executing for too long. At least one detected problem appears to be network related. In case you are using a WLAN adapter, try disabling it to get better results. One problem may be related to power management, disable CPU throttling settings in Control Panel and BIOS setup. Check for BIOS updates.
LatencyMon has been analyzing your system for  0:00:56  (h:mm:ss) on all processors.


_________________________________________________________________________________________________________
SYSTEM INFORMATION
_________________________________________________________________________________________________________
Computer name:                                        LAPTOP-TRAVIS
OS version:                                           Windows 11, 10.0, version 2009, build: 22000 (x64)
Hardware:                                             HP Pavilion Laptop 15-ck0xx, HP
BIOS:                                                 F.15
CPU:                                                  GenuineIntel Intel® Core™ i5-8250U CPU @ 1.60GHz
Logical processors:                                   8
Processor groups:                                     1
Processor group size:                                 8
RAM:                                                  8078 MB total


_________________________________________________________________________________________________________
CPU SPEED
_________________________________________________________________________________________________________
Reported CPU speed (WMI):                             160 MHz
Reported CPU speed (registry):                        180 MHz

Note: reported execution times may be calculated based on a fixed reported CPU speed. Disable variable speed settings like Intel Speed Step and AMD Cool N Quiet in the BIOS setup for more accurate results.


_________________________________________________________________________________________________________
MEASURED INTERRUPT TO USER PROCESS LATENCIES
_________________________________________________________________________________________________________
The interrupt to process latency reflects the measured interval that a usermode process needed to respond to a hardware request from the moment the interrupt service routine started execution. This includes the scheduling and execution of a DPC routine, the signaling of an event and the waking up of a usermode thread from an idle wait state in response to that event.

Highest measured interrupt to process latency (µs):   2429.20
Average measured interrupt to process latency (µs):   10.099614

Highest measured interrupt to DPC latency (µs):       478.10
Average measured interrupt to DPC latency (µs):       2.952394


_________________________________________________________________________________________________________
 REPORTED ISRs
_________________________________________________________________________________________________________
Interrupt service routines are routines installed by the OS and device drivers that execute in response to a hardware interrupt signal.

Highest ISR routine execution time (µs):              107.096111
Driver with highest ISR routine execution time:       ACPI.sys - ACPI Driver for NT, Microsoft Corporation

Highest reported total ISR routine time (%):          0.001601
Driver with highest ISR total time:                   ACPI.sys - ACPI Driver for NT, Microsoft Corporation

Total time spent in ISRs (%)                          0.003976

ISR count (execution time <250 µs):                   2162
ISR count (execution time 250-500 µs):                0
ISR count (execution time 500-1000 µs):               0
ISR count (execution time 1000-2000 µs):              0
ISR count (execution time 2000-4000 µs):              0
ISR count (execution time >=4000 µs):                 0


_________________________________________________________________________________________________________
REPORTED DPCs
_________________________________________________________________________________________________________
DPC routines are part of the interrupt servicing dispatch mechanism and disable the possibility for a process to utilize the CPU while it is interrupted until the DPC has finished execution.

Highest DPC routine execution time (µs):              2488.950556
Driver with highest DPC routine execution time:       ndis.sys - Network Driver Interface Specification (NDIS), Microsoft Corporation

Highest reported total DPC routine time (%):          0.025223
Driver with highest DPC total execution time:         storport.sys - Microsoft Storage Port Driver, Microsoft Corporation

Total time spent in DPCs (%)                          0.077267

DPC count (execution time <250 µs):                   38912
DPC count (execution time 250-500 µs):                0
DPC count (execution time 500-10000 µs):              42
DPC count (execution time 1000-2000 µs):              0
DPC count (execution time 2000-4000 µs):              3
DPC count (execution time >=4000 µs):                 0


_________________________________________________________________________________________________________
 REPORTED HARD PAGEFAULTS
_________________________________________________________________________________________________________
Hard pagefaults are events that get triggered by making use of virtual memory that is not resident in RAM but backed by a memory mapped file on disk. The process of resolving the hard pagefault requires reading in the memory from disk while the process is interrupted and blocked from execution.

NOTE: some processes were hit by hard pagefaults. If these were programs producing audio, they are likely to interrupt the audio stream resulting in dropouts, clicks and pops. Check the Processes tab to see which programs were hit.

Process with highest pagefault count:                 yourphone.exe

Total number of hard pagefaults                       2350
Hard pagefault count of hardest hit process:          209
Number of processes hit:                              46


_________________________________________________________________________________________________________
 PER CPU DATA
_________________________________________________________________________________________________________
CPU 0 Interrupt cycle time (s):                       1.027552
CPU 0 ISR highest execution time (µs):                107.096111
CPU 0 ISR total execution time (s):                   0.017910
CPU 0 ISR count:                                      2154
CPU 0 DPC highest execution time (µs):                2488.950556
CPU 0 DPC total execution time (s):                   0.334920
CPU 0 DPC count:                                      36868
_________________________________________________________________________________________________________
CPU 1 Interrupt cycle time (s):                       0.335683
CPU 1 ISR highest execution time (µs):                0.907778
CPU 1 ISR total execution time (s):                   0.000003
CPU 1 ISR count:                                      4
CPU 1 DPC highest execution time (µs):                129.095556
CPU 1 DPC total execution time (s):                   0.000188
CPU 1 DPC count:                                      21
_________________________________________________________________________________________________________
CPU 2 Interrupt cycle time (s):                       0.445741
CPU 2 ISR highest execution time (µs):                0.802778
CPU 2 ISR total execution time (s):                   0.000003
CPU 2 ISR count:                                      4
CPU 2 DPC highest execution time (µs):                58.689444
CPU 2 DPC total execution time (s):                   0.001627
CPU 2 DPC count:                                      333
_________________________________________________________________________________________________________
CPU 3 Interrupt cycle time (s):                       0.392423
CPU 3 ISR highest execution time (µs):                0.0
CPU 3 ISR total execution time (s):                   0.0
CPU 3 ISR count:                                      0
CPU 3 DPC highest execution time (µs):                55.802222
CPU 3 DPC total execution time (s):                   0.000824
CPU 3 DPC count:                                      148
_________________________________________________________________________________________________________
CPU 4 Interrupt cycle time (s):                       1.135868
CPU 4 ISR highest execution time (µs):                0.0
CPU 4 ISR total execution time (s):                   0.0
CPU 4 ISR count:                                      0
CPU 4 DPC highest execution time (µs):                29.702778
CPU 4 DPC total execution time (s):                   0.000962
CPU 4 DPC count:                                      256
_________________________________________________________________________________________________________
CPU 5 Interrupt cycle time (s):                       0.729655
CPU 5 ISR highest execution time (µs):                0.0
CPU 5 ISR total execution time (s):                   0.0
CPU 5 ISR count:                                      0
CPU 5 DPC highest execution time (µs):                113.4850
CPU 5 DPC total execution time (s):                   0.007618
CPU 5 DPC count:                                      984
_________________________________________________________________________________________________________
CPU 6 Interrupt cycle time (s):                       0.266697
CPU 6 ISR highest execution time (µs):                0.0
CPU 6 ISR total execution time (s):                   0.0
CPU 6 ISR count:                                      0
CPU 6 DPC highest execution time (µs):                71.531111
CPU 6 DPC total execution time (s):                   0.000873
CPU 6 DPC count:                                      155
_________________________________________________________________________________________________________
CPU 7 Interrupt cycle time (s):                       0.297311
CPU 7 ISR highest execution time (µs):                0.0
CPU 7 ISR total execution time (s):                   0.0
CPU 7 ISR count:                                      0
CPU 7 DPC highest execution time (µs):                52.344444
CPU 7 DPC total execution time (s):                   0.001175
CPU 7 DPC count:                                      192
_________________________________________________________________________________________________________


Attached Thumbnails

  • Shell Screenshot 2022-07-09 195846.jpg
  • Processes Screenshot 2022-07-09 195942.jpg

  • 0

#37
RKinner

RKinner

    Malware Expert

  • Expert
  • 24,624 posts
  • MVP

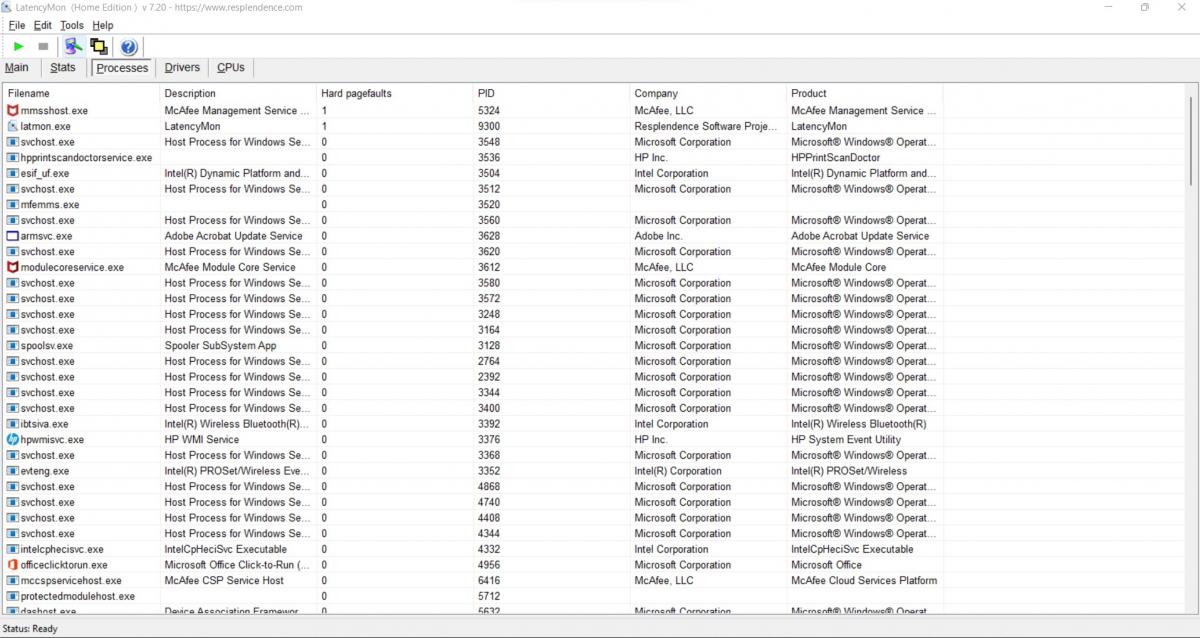
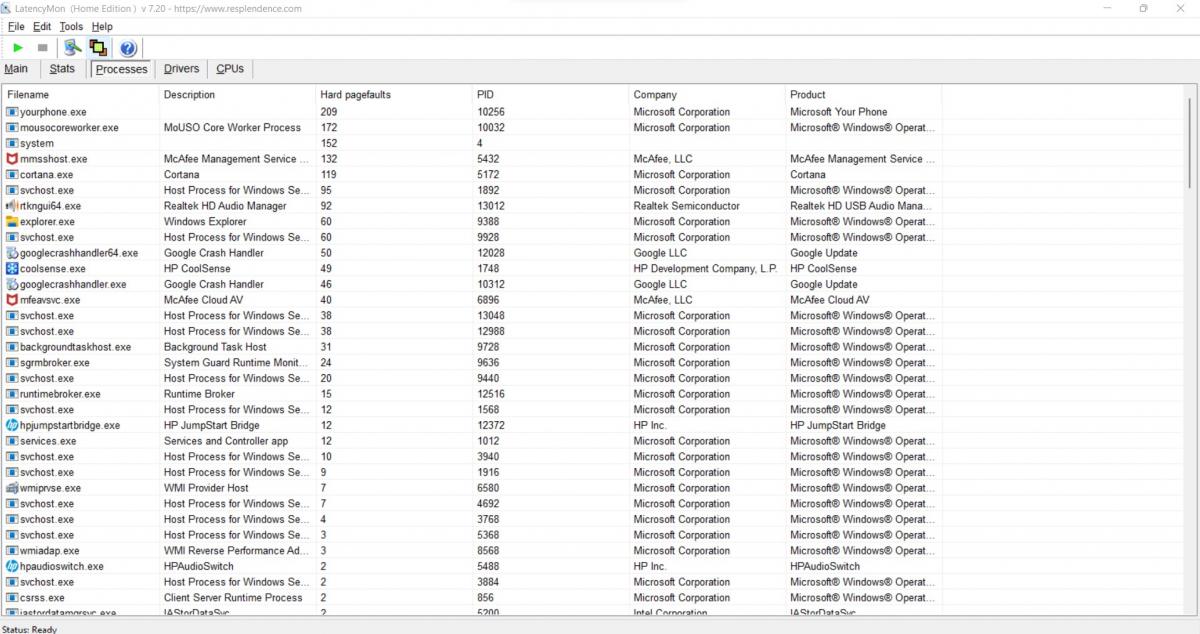
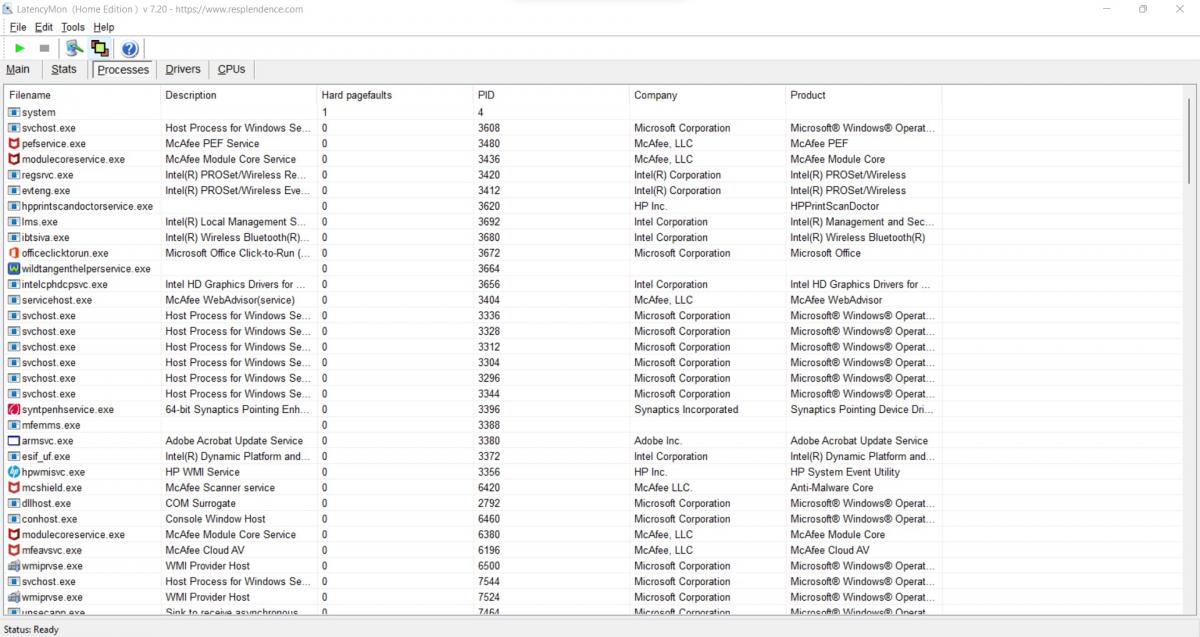
It's best to wait about 5 minutes after a reboot to allow things to settle down before running Latency Monitor.


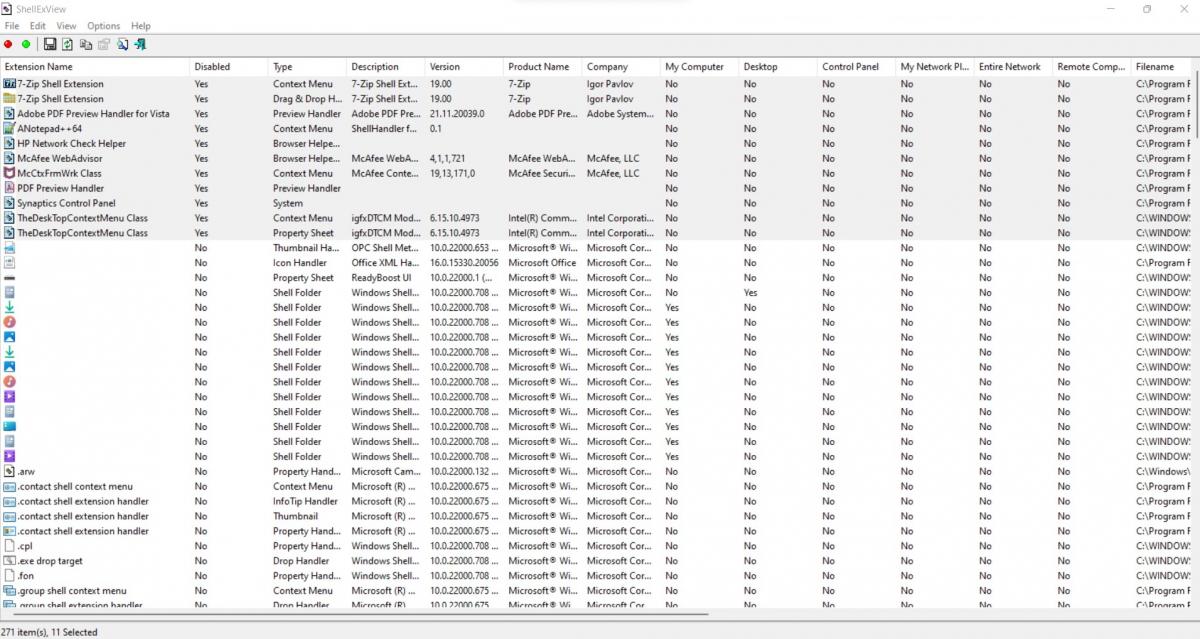
I see YourPhone in the list.  It's unlikely that you need this:


https://www.makeuseo...hone-app-guide/


to remove:


https://www.windowsc...-app-windows-10


(X out of the popup window)


We can also remove Googlecrashhandler:

https://techdows.com...exe-how-to.html


mousocoreworker is Windows Update.  It runs after every boot to check to see if there are any updates.  That we see it in the list means you didn't wait long enough before running Latency Monitor.


It seems that every time we use the Internet the slowness returns.  Perhaps resetting TCP will help:


Search for 

cmd

It will find Command Prompt.  Right click and Run As Admin.

Type:


netsh winsock reset catalog
hit Enter.
 
netsh int ipv4 reset reset.log
Hit Enter
netsh int ipv6 reset reset6.log
hit Enter
 
Reboot.  Remember to wait about 5 minutes for things to settle down before running Latency Monitor.
 
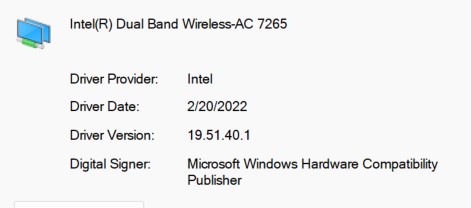
Let's also check which version of the network driver we are using.
 
Search for
device manager
hit Enter
click on the arrow in front of Network Adapters
right click on your WiFi adapter and select Properties then click on the Driver tab.  What date and Version number does it show?

  • 0

#38
ttbcs

ttbcs

    Member

  • Topic Starter
  • Member
  • PipPipPip
  • 102 posts

I followed the sets with YourPhone and Googlecrashhandler. While doing this I noticed the instruction for Googlecrashhandler that each google product needs to turn off the crash report setting. This got me thinking, there is another user of this machine. I am sorry I did not bring this up earlier. Were the changes made globally or are there steps I need to repeat under that login?


Also, I removed McAfee from the browsers on both logins and disabled them in ShellExView, image attached. There were no Hard pagefaults listed so I didn't attach a screen shot of that.


I attached a screen shot of the WiFi adapter.


_________________________________________________________________________________________________________
CONCLUSION
_________________________________________________________________________________________________________
Your system appears to be suitable for handling real-time audio and other tasks without dropouts.
LatencyMon has been analyzing your system for  0:00:59  (h:mm:ss) on all processors.


_________________________________________________________________________________________________________
SYSTEM INFORMATION
_________________________________________________________________________________________________________
Computer name:                                        LAPTOP-TRAVIS
OS version:                                           Windows 11, 10.0, version 2009, build: 22000 (x64)
Hardware:                                             HP Pavilion Laptop 15-ck0xx, HP
BIOS:                                                 F.15
CPU:                                                  GenuineIntel Intel® Core™ i5-8250U CPU @ 1.60GHz
Logical processors:                                   8
Processor groups:                                     1
Processor group size:                                 8
RAM:                                                  8078 MB total


_________________________________________________________________________________________________________
CPU SPEED
_________________________________________________________________________________________________________
Reported CPU speed (WMI):                             160 MHz
Reported CPU speed (registry):                        180 MHz

Note: reported execution times may be calculated based on a fixed reported CPU speed. Disable variable speed settings like Intel Speed Step and AMD Cool N Quiet in the BIOS setup for more accurate results.


_________________________________________________________________________________________________________
MEASURED INTERRUPT TO USER PROCESS LATENCIES
_________________________________________________________________________________________________________
The interrupt to process latency reflects the measured interval that a usermode process needed to respond to a hardware request from the moment the interrupt service routine started execution. This includes the scheduling and execution of a DPC routine, the signaling of an event and the waking up of a usermode thread from an idle wait state in response to that event.

Highest measured interrupt to process latency (µs):   379.80
Average measured interrupt to process latency (µs):   8.624789

Highest measured interrupt to DPC latency (µs):       338.60
Average measured interrupt to DPC latency (µs):       3.139471


_________________________________________________________________________________________________________
 REPORTED ISRs
_________________________________________________________________________________________________________
Interrupt service routines are routines installed by the OS and device drivers that execute in response to a hardware interrupt signal.

Highest ISR routine execution time (µs):              103.784444
Driver with highest ISR routine execution time:       ACPI.sys - ACPI Driver for NT, Microsoft Corporation

Highest reported total ISR routine time (%):          0.001523
Driver with highest ISR total time:                   ACPI.sys - ACPI Driver for NT, Microsoft Corporation

Total time spent in ISRs (%)                          0.001652

ISR count (execution time <250 µs):                   334
ISR count (execution time 250-500 µs):                0
ISR count (execution time 500-1000 µs):               0
ISR count (execution time 1000-2000 µs):              0
ISR count (execution time 2000-4000 µs):              0
ISR count (execution time >=4000 µs):                 0


_________________________________________________________________________________________________________
REPORTED DPCs
_________________________________________________________________________________________________________
DPC routines are part of the interrupt servicing dispatch mechanism and disable the possibility for a process to utilize the CPU while it is interrupted until the DPC has finished execution.

Highest DPC routine execution time (µs):              661.557222
Driver with highest DPC routine execution time:       ACPI.sys - ACPI Driver for NT, Microsoft Corporation

Highest reported total DPC routine time (%):          0.016793
Driver with highest DPC total execution time:         rspLLL64.sys - Resplendence Latency Monitoring and Auxiliary Kernel Library, Resplendence Software Projects Sp.

Total time spent in DPCs (%)                          0.034231

DPC count (execution time <250 µs):                   29338
DPC count (execution time 250-500 µs):                0
DPC count (execution time 500-10000 µs):              38
DPC count (execution time 1000-2000 µs):              0
DPC count (execution time 2000-4000 µs):              0
DPC count (execution time >=4000 µs):                 0


_________________________________________________________________________________________________________
 REPORTED HARD PAGEFAULTS
_________________________________________________________________________________________________________
Hard pagefaults are events that get triggered by making use of virtual memory that is not resident in RAM but backed by a memory mapped file on disk. The process of resolving the hard pagefault requires reading in the memory from disk while the process is interrupted and blocked from execution.


Process with highest pagefault count:                 none

Total number of hard pagefaults                       0
Hard pagefault count of hardest hit process:          0
Number of processes hit:                              0


_________________________________________________________________________________________________________
 PER CPU DATA
_________________________________________________________________________________________________________
CPU 0 Interrupt cycle time (s):                       0.4780
CPU 0 ISR highest execution time (µs):                103.784444
CPU 0 ISR total execution time (s):                   0.007822
CPU 0 ISR count:                                      323
CPU 0 DPC highest execution time (µs):                661.557222
CPU 0 DPC total execution time (s):                   0.157733
CPU 0 DPC count:                                      29070
_________________________________________________________________________________________________________
CPU 1 Interrupt cycle time (s):                       0.170401
CPU 1 ISR highest execution time (µs):                0.0
CPU 1 ISR total execution time (s):                   0.0
CPU 1 ISR count:                                      0
CPU 1 DPC highest execution time (µs):                0.0
CPU 1 DPC total execution time (s):                   0.0
CPU 1 DPC count:                                      0
_________________________________________________________________________________________________________
CPU 2 Interrupt cycle time (s):                       0.163336
CPU 2 ISR highest execution time (µs):                0.905556
CPU 2 ISR total execution time (s):                   0.000001
CPU 2 ISR count:                                      1
CPU 2 DPC highest execution time (µs):                13.862222
CPU 2 DPC total execution time (s):                   0.000043
CPU 2 DPC count:                                      12
_________________________________________________________________________________________________________
CPU 3 Interrupt cycle time (s):                       0.168502
CPU 3 ISR highest execution time (µs):                0.0
CPU 3 ISR total execution time (s):                   0.0
CPU 3 ISR count:                                      0
CPU 3 DPC highest execution time (µs):                51.241111
CPU 3 DPC total execution time (s):                   0.000124
CPU 3 DPC count:                                      25
_________________________________________________________________________________________________________
CPU 4 Interrupt cycle time (s):                       0.319937
CPU 4 ISR highest execution time (µs):                0.0
CPU 4 ISR total execution time (s):                   0.0
CPU 4 ISR count:                                      0
CPU 4 DPC highest execution time (µs):                0.0
CPU 4 DPC total execution time (s):                   0.0
CPU 4 DPC count:                                      0
_________________________________________________________________________________________________________
CPU 5 Interrupt cycle time (s):                       0.282127
CPU 5 ISR highest execution time (µs):                0.0
CPU 5 ISR total execution time (s):                   0.0
CPU 5 ISR count:                                      0
CPU 5 DPC highest execution time (µs):                0.0
CPU 5 DPC total execution time (s):                   0.0
CPU 5 DPC count:                                      0
_________________________________________________________________________________________________________
CPU 6 Interrupt cycle time (s):                       1.240922
CPU 6 ISR highest execution time (µs):                1.601111
CPU 6 ISR total execution time (s):                   0.000012
CPU 6 ISR count:                                      10
CPU 6 DPC highest execution time (µs):                26.273333
CPU 6 DPC total execution time (s):                   0.000072
CPU 6 DPC count:                                      13
_________________________________________________________________________________________________________
CPU 7 Interrupt cycle time (s):                       0.753462
CPU 7 ISR highest execution time (µs):                0.0
CPU 7 ISR total execution time (s):                   0.0
CPU 7 ISR count:                                      0
CPU 7 DPC highest execution time (µs):                63.493333
CPU 7 DPC total execution time (s):                   0.004370
CPU 7 DPC count:                                      256
_________________________________________________________________________________________________________


Attached Thumbnails

  • WiFi Screenshot 2022-07-11 150712.jpg
  • Shell Screenshot 2022-07-11 152401.jpg

  • 0

#39
RKinner

RKinner

    Malware Expert

  • Expert
  • 24,624 posts
  • MVP

It looks like there is a newer version of your WiFi driver:


https://www.intel.co.../downloads.html


Windows® 10 and Windows 11* Wi-Fi Drivers for Intel® Wireless Adapters
3/25/2022
Windows 10, 32-bit*,
Windows 10, 64-bit*,
Windows 11 Family*
1 More
 
Description: This download record installs the Windows® 10 and Windows 11* WiFi package drivers 22.140.0 for the Wi-Fi 6E/Wi-Fi 6/9000/8000 series Intel® Wireless Adapters. View download options.
 
Version: 22.140.0
 
Have we tried installing it?

  • 0

#40
ttbcs

ttbcs

    Member

  • Topic Starter
  • Member
  • PipPipPip
  • 102 posts

We have not tried installing it.


  • 0

Advertisements


#41
RKinner

RKinner

    Malware Expert

  • Expert
  • 24,624 posts
  • MVP

See if it will install.  If so then try Latency Monitor with a browser open to geekstogo.com only.


  • 0

#42
ttbcs

ttbcs

    Member

  • Topic Starter
  • Member
  • PipPipPip
  • 102 posts

_________________________________________________________________________________________________________
CONCLUSION
_________________________________________________________________________________________________________
Your system appears to be suitable for handling real-time audio and other tasks without dropouts.
LatencyMon has been analyzing your system for  0:00:57  (h:mm:ss) on all processors.


_________________________________________________________________________________________________________
SYSTEM INFORMATION
_________________________________________________________________________________________________________
Computer name:                                        LAPTOP-TRAVIS
OS version:                                           Windows 11, 10.0, version 2009, build: 22000 (x64)
Hardware:                                             HP Pavilion Laptop 15-ck0xx, HP
BIOS:                                                 F.15
CPU:                                                  GenuineIntel Intel® Core™ i5-8250U CPU @ 1.60GHz
Logical processors:                                   8
Processor groups:                                     1
Processor group size:                                 8
RAM:                                                  8078 MB total


_________________________________________________________________________________________________________
CPU SPEED
_________________________________________________________________________________________________________
Reported CPU speed (WMI):                             160 MHz
Reported CPU speed (registry):                        180 MHz

Note: reported execution times may be calculated based on a fixed reported CPU speed. Disable variable speed settings like Intel Speed Step and AMD Cool N Quiet in the BIOS setup for more accurate results.


_________________________________________________________________________________________________________
MEASURED INTERRUPT TO USER PROCESS LATENCIES
_________________________________________________________________________________________________________
The interrupt to process latency reflects the measured interval that a usermode process needed to respond to a hardware request from the moment the interrupt service routine started execution. This includes the scheduling and execution of a DPC routine, the signaling of an event and the waking up of a usermode thread from an idle wait state in response to that event.

Highest measured interrupt to process latency (µs):   744.20
Average measured interrupt to process latency (µs):   23.631361

Highest measured interrupt to DPC latency (µs):       680.20
Average measured interrupt to DPC latency (µs):       6.191920


_________________________________________________________________________________________________________
 REPORTED ISRs
_________________________________________________________________________________________________________
Interrupt service routines are routines installed by the OS and device drivers that execute in response to a hardware interrupt signal.

Highest ISR routine execution time (µs):              131.40
Driver with highest ISR routine execution time:       ACPI.sys - ACPI Driver for NT, Microsoft Corporation

Highest reported total ISR routine time (%):          0.000941
Driver with highest ISR total time:                   ACPI.sys - ACPI Driver for NT, Microsoft Corporation

Total time spent in ISRs (%)                          0.001160

ISR count (execution time <250 µs):                   204
ISR count (execution time 250-500 µs):                0
ISR count (execution time 500-1000 µs):               0
ISR count (execution time 1000-2000 µs):              0
ISR count (execution time 2000-4000 µs):              0
ISR count (execution time >=4000 µs):                 0


_________________________________________________________________________________________________________
REPORTED DPCs
_________________________________________________________________________________________________________
DPC routines are part of the interrupt servicing dispatch mechanism and disable the possibility for a process to utilize the CPU while it is interrupted until the DPC has finished execution.

Highest DPC routine execution time (µs):              787.973333
Driver with highest DPC routine execution time:       tcpip.sys - TCP/IP Driver, Microsoft Corporation

Highest reported total DPC routine time (%):          0.024003
Driver with highest DPC total execution time:         rspLLL64.sys - Resplendence Latency Monitoring and Auxiliary Kernel Library, Resplendence Software Projects Sp.

Total time spent in DPCs (%)                          0.060251

DPC count (execution time <250 µs):                   18704
DPC count (execution time 250-500 µs):                0
DPC count (execution time 500-10000 µs):              25
DPC count (execution time 1000-2000 µs):              0
DPC count (execution time 2000-4000 µs):              0
DPC count (execution time >=4000 µs):                 0


_________________________________________________________________________________________________________
 REPORTED HARD PAGEFAULTS
_________________________________________________________________________________________________________
Hard pagefaults are events that get triggered by making use of virtual memory that is not resident in RAM but backed by a memory mapped file on disk. The process of resolving the hard pagefault requires reading in the memory from disk while the process is interrupted and blocked from execution.

NOTE: some processes were hit by hard pagefaults. If these were programs producing audio, they are likely to interrupt the audio stream resulting in dropouts, clicks and pops. Check the Processes tab to see which programs were hit.

Process with highest pagefault count:                 system

Total number of hard pagefaults                       1
Hard pagefault count of hardest hit process:          1
Number of processes hit:                              1


_________________________________________________________________________________________________________
 PER CPU DATA
_________________________________________________________________________________________________________
CPU 0 Interrupt cycle time (s):                       0.993573
CPU 0 ISR highest execution time (µs):                131.40
CPU 0 ISR total execution time (s):                   0.005270
CPU 0 ISR count:                                      191
CPU 0 DPC highest execution time (µs):                721.140
CPU 0 DPC total execution time (s):                   0.197747
CPU 0 DPC count:                                      15098
_________________________________________________________________________________________________________
CPU 1 Interrupt cycle time (s):                       0.393785
CPU 1 ISR highest execution time (µs):                0.0
CPU 1 ISR total execution time (s):                   0.0
CPU 1 ISR count:                                      0
CPU 1 DPC highest execution time (µs):                31.3950
CPU 1 DPC total execution time (s):                   0.000047
CPU 1 DPC count:                                      2
_________________________________________________________________________________________________________
CPU 2 Interrupt cycle time (s):                       0.553030
CPU 2 ISR highest execution time (µs):                3.581111
CPU 2 ISR total execution time (s):                   0.000007
CPU 2 ISR count:                                      2
CPU 2 DPC highest execution time (µs):                104.004444
CPU 2 DPC total execution time (s):                   0.000353
CPU 2 DPC count:                                      10
_________________________________________________________________________________________________________
CPU 3 Interrupt cycle time (s):                       0.493885
CPU 3 ISR highest execution time (µs):                0.0
CPU 3 ISR total execution time (s):                   0.0
CPU 3 ISR count:                                      0
CPU 3 DPC highest execution time (µs):                206.457222
CPU 3 DPC total execution time (s):                   0.000722
CPU 3 DPC count:                                      25
_________________________________________________________________________________________________________
CPU 4 Interrupt cycle time (s):                       1.504243
CPU 4 ISR highest execution time (µs):                9.996667
CPU 4 ISR total execution time (s):                   0.000035
CPU 4 ISR count:                                      8
CPU 4 DPC highest execution time (µs):                86.943889
CPU 4 DPC total execution time (s):                   0.002989
CPU 4 DPC count:                                      275
_________________________________________________________________________________________________________
CPU 5 Interrupt cycle time (s):                       1.616808
CPU 5 ISR highest execution time (µs):                1.7150
CPU 5 ISR total execution time (s):                   0.000003
CPU 5 ISR count:                                      2
CPU 5 DPC highest execution time (µs):                787.973333
CPU 5 DPC total execution time (s):                   0.072996
CPU 5 DPC count:                                      3270
_________________________________________________________________________________________________________
CPU 6 Interrupt cycle time (s):                       0.380106
CPU 6 ISR highest execution time (µs):                4.216111
CPU 6 ISR total execution time (s):                   0.000004
CPU 6 ISR count:                                      1
CPU 6 DPC highest execution time (µs):                65.676111
CPU 6 DPC total execution time (s):                   0.000440
CPU 6 DPC count:                                      22
_________________________________________________________________________________________________________
CPU 7 Interrupt cycle time (s):                       0.383880
CPU 7 ISR highest execution time (µs):                0.0
CPU 7 ISR total execution time (s):                   0.0
CPU 7 ISR count:                                      0
CPU 7 DPC highest execution time (µs):                348.195556
CPU 7 DPC total execution time (s):                   0.001030
CPU 7 DPC count:                                      27
_________________________________________________________________________________________________________


Attached Thumbnails

  • Processes Screenshot 2022-07-13 172757.jpg

  • 0

#43
RKinner

RKinner

    Malware Expert

  • Expert
  • 24,624 posts
  • MVP

That looks pretty good.  How is the PC running now?


  • 0

#44
ttbcs

ttbcs

    Member

  • Topic Starter
  • Member
  • PipPipPip
  • 102 posts
Seems to be running smoothly
  • 0

#45
ttbcs

ttbcs

    Member

  • Topic Starter
  • Member
  • PipPipPip
  • 102 posts
Thank you for your help. Is it okay to remove the software we used?
  • 0


Similar Topics

0 user(s) are reading this topic

0 members, 0 guests, 0 anonymous users

As Featured On:

Microsoft Yahoo BBC MSN PC Magazine Washington Post HP