
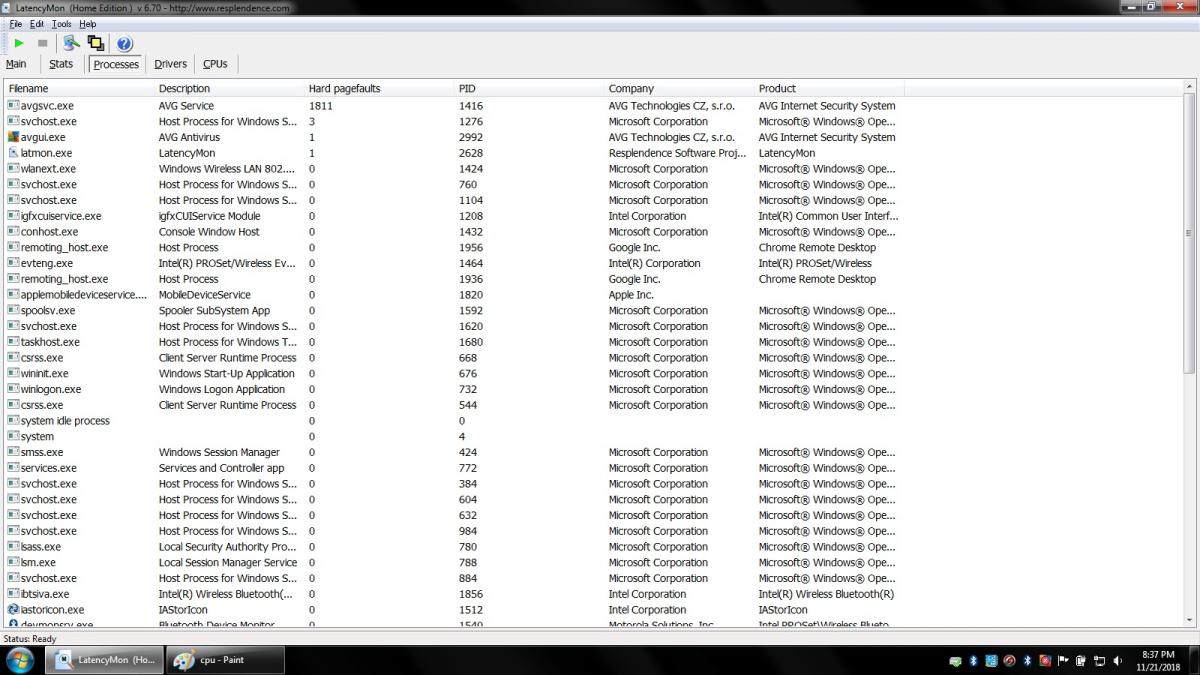
In Latency Monitor, on the Processes tab there is a column for Page Faults. If you click on the header once or twice it will sort things so the page faults are at the top. Can I get a screen shot of that?

various issues, interesting ones at that
Started by
darkmj16
, Nov 07 2018 04:19 AM

#47

 Posted 20 November 2018 - 09:32 PM
darkmj16
- Topic Starter
-
- Member
-

- 194 posts
Member
i think this is what your looking for. this test doesnt seem to be revealing as much like the 1st time. i know when i saw the 1st report it had way more things with numbers... (makes sense i know) but heres the screen shot.
Attached Thumbnails

#48
Posted 21 November 2018 - 06:54 AM
RKinner
-

- Expert
-

- 24,625 posts
Malware Expert
Close Chrome and pause AVG and then try HD Tune again.
#49
Posted 21 November 2018 - 07:42 PM
darkmj16
- Topic Starter
-
- Member
-
- 194 posts
Member
alright. heres the tests again. this test was done after boot up, windows fully loaded and idle for a little bit before being used. AVG is paused.
_________________________________________________________________________________________________________
CONCLUSION
_________________________________________________________________________________________________________
Your system appears to be having trouble handling real-time audio and other tasks. You are likely to experience buffer underruns appearing as drop outs, clicks or pops. One problem may be related to power management, disable CPU throttling settings in Control Panel and BIOS setup. Check for BIOS updates.
LatencyMon has been analyzing your system for 0:04:18 (h:mm:ss) on all processors.
_________________________________________________________________________________________________________
SYSTEM INFORMATION
_________________________________________________________________________________________________________
Computer name: USER-PC
OS version: Windows 7 Service Pack 1, 6.1, build: 7601 (x64)
Hardware: Inspiron 5737, Dell Inc., 073H4P
CPU: GenuineIntel Intel® Core™ i5-4200U CPU @ 1.60GHz
Logical processors: 4
Processor groups: 1
RAM: 8080 MB total
_________________________________________________________________________________________________________
CPU SPEED
_________________________________________________________________________________________________________
Reported CPU speed: 2294 MHz
Note: reported execution times may be calculated based on a fixed reported CPU speed. Disable variable speed settings like Intel Speed Step and AMD Cool N Quiet in the BIOS setup for more accurate results.
_________________________________________________________________________________________________________
MEASURED INTERRUPT TO USER PROCESS LATENCIES
_________________________________________________________________________________________________________
The interrupt to process latency reflects the measured interval that a usermode process needed to respond to a hardware request from the moment the interrupt service routine started execution. This includes the scheduling and execution of a DPC routine, the signaling of an event and the waking up of a usermode thread from an idle wait state in response to that event.
Highest measured interrupt to process latency (µs): 18258.643817
Average measured interrupt to process latency (µs): 8.732145
Highest measured interrupt to DPC latency (µs): 107.989144
Average measured interrupt to DPC latency (µs): 1.145375
_________________________________________________________________________________________________________
REPORTED ISRs
_________________________________________________________________________________________________________
Interrupt service routines are routines installed by the OS and device drivers that execute in response to a hardware interrupt signal.
Highest ISR routine execution time (µs): 57.407149
Driver with highest ISR routine execution time: ACPI.sys - ACPI Driver for NT, Microsoft Corporation
Highest reported total ISR routine time (%): 0.004137
Driver with highest ISR total time: hal.dll - Hardware Abstraction Layer DLL, Microsoft Corporation
Total time spent in ISRs (%) 0.004889
ISR count (execution time <250 µs): 14179
ISR count (execution time 250-500 µs): 0
ISR count (execution time 500-999 µs): 0
ISR count (execution time 1000-1999 µs): 0
ISR count (execution time 2000-3999 µs): 0
ISR count (execution time >=4000 µs): 0
_________________________________________________________________________________________________________
REPORTED DPCs
_________________________________________________________________________________________________________
DPC routines are part of the interrupt servicing dispatch mechanism and disable the possibility for a process to utilize the CPU while it is interrupted until the DPC has finished execution.
Highest DPC routine execution time (µs): 145.316914
Driver with highest DPC routine execution time: USBPORT.SYS - USB 1.1 & 2.0 Port Driver, Microsoft Corporation
Highest reported total DPC routine time (%): 0.144746
Driver with highest DPC total execution time: iaStorA.sys - Intel® Rapid Storage Technology driver - x64, Intel Corporation
Total time spent in DPCs (%) 0.266424
DPC count (execution time <250 µs): 331999
DPC count (execution time 250-500 µs): 0
DPC count (execution time 500-999 µs): 0
DPC count (execution time 1000-1999 µs): 0
DPC count (execution time 2000-3999 µs): 0
DPC count (execution time >=4000 µs): 0
_________________________________________________________________________________________________________
REPORTED HARD PAGEFAULTS
_________________________________________________________________________________________________________
Hard pagefaults are events that get triggered by making use of virtual memory that is not resident in RAM but backed by a memory mapped file on disk. The process of resolving the hard pagefault requires reading in the memory from disk while the process is interrupted and blocked from execution.
NOTE: some processes were hit by hard pagefaults. If these were programs producing audio, they are likely to interrupt the audio stream resulting in dropouts, clicks and pops. Check the Processes tab to see which programs were hit.
Process with highest pagefault count: avgsvc.exe
Total number of hard pagefaults 3804
Hard pagefault count of hardest hit process: 1904
Number of processes hit: 4
_________________________________________________________________________________________________________
PER CPU DATA
_________________________________________________________________________________________________________
CPU 0 Interrupt cycle time (s): 1.018362
CPU 0 ISR highest execution time (µs): 57.407149
CPU 0 ISR total execution time (s): 0.044170
CPU 0 ISR count: 13548
CPU 0 DPC highest execution time (µs): 133.834350
CPU 0 DPC total execution time (s): 0.342850
CPU 0 DPC count: 92003
_________________________________________________________________________________________________________
CPU 1 Interrupt cycle time (s): 6.477556
CPU 1 ISR highest execution time (µs): 57.321709
CPU 1 ISR total execution time (s): 0.006418
CPU 1 ISR count: 631
CPU 1 DPC highest execution time (µs): 145.316914
CPU 1 DPC total execution time (s): 2.405387
CPU 1 DPC count: 237591
_________________________________________________________________________________________________________
CPU 2 Interrupt cycle time (s): 0.224733
CPU 2 ISR highest execution time (µs): 0.0
CPU 2 ISR total execution time (s): 0.0
CPU 2 ISR count: 0
CPU 2 DPC highest execution time (µs): 45.415867
CPU 2 DPC total execution time (s): 0.008291
CPU 2 DPC count: 2372
_________________________________________________________________________________________________________
CPU 3 Interrupt cycle time (s): 0.364117
CPU 3 ISR highest execution time (µs): 0.0
CPU 3 ISR total execution time (s): 0.0
CPU 3 ISR count: 0
CPU 3 DPC highest execution time (µs): 7.028771
CPU 3 DPC total execution time (s): 0.000062
CPU 3 DPC count: 33
_________________________________________________________________________________________________________
Attached Thumbnails


#50
Posted 21 November 2018 - 09:33 PM
RKinner
-
- Expert
-
- 24,625 posts
Malware Expert
Your antivirus is still running and is causing page faults. Try it in Safe Mode
(Reboot and when you see the maker's logo, hear a beep or it talks about F8, start tapping the F8 key slowly. Keep tapping until the Safe Mode Menu appears and choose Safe Mode. Login with your usual login.)
I've found that MalwareBytes also causes a lot of problems with this test so make sure it is not running if you have it.
I am seeing signs that you may need a BIOS update tho you have one from this year. What make and model and service tag is your PC?
#51
Posted 21 November 2018 - 09:52 PM
darkmj16
- Topic Starter
-
- Member
-
- 194 posts
Member
hmm. i do have mbam but its sat to not start with windows. umm... avg. o i start the lanmon test right before i shut off avg, then opened hd tune, ran it, closed hd tune then stop lanmon test. still want me to try safe mode? im pretty sure avg starts in safe mode tho. not sure.
but heres an interesting thing... i decided to run the lanmon test during normal operation and heres the result. for the 2nd test anyway. the 1st test had 6 faults, including the process "system"
_________________________________________________________________________________________________________
CONCLUSION
_________________________________________________________________________________________________________
Your system appears to be having trouble handling real-time audio and other tasks. You are likely to experience buffer underruns appearing as drop outs, clicks or pops. One problem may be related to power management, disable CPU throttling settings in Control Panel and BIOS setup. Check for BIOS updates.
LatencyMon has been analyzing your system for 0:05:36 (h:mm:ss) on all processors.
_________________________________________________________________________________________________________
SYSTEM INFORMATION
_________________________________________________________________________________________________________
Computer name: USER-PC
OS version: Windows 7 Service Pack 1, 6.1, build: 7601 (x64)
Hardware: Inspiron 5737, Dell Inc., 073H4P
CPU: GenuineIntel Intel® Core™ i5-4200U CPU @ 1.60GHz
Logical processors: 4
Processor groups: 1
RAM: 8080 MB total
_________________________________________________________________________________________________________
CPU SPEED
_________________________________________________________________________________________________________
Reported CPU speed: 2294 MHz
Note: reported execution times may be calculated based on a fixed reported CPU speed. Disable variable speed settings like Intel Speed Step and AMD Cool N Quiet in the BIOS setup for more accurate results.
_________________________________________________________________________________________________________
MEASURED INTERRUPT TO USER PROCESS LATENCIES
_________________________________________________________________________________________________________
The interrupt to process latency reflects the measured interval that a usermode process needed to respond to a hardware request from the moment the interrupt service routine started execution. This includes the scheduling and execution of a DPC routine, the signaling of an event and the waking up of a usermode thread from an idle wait state in response to that event.
Highest measured interrupt to process latency (µs): 26801.388330
Average measured interrupt to process latency (µs): 16.165295
Highest measured interrupt to DPC latency (µs): 654.182170
Average measured interrupt to DPC latency (µs): 5.579917
_________________________________________________________________________________________________________
REPORTED ISRs
_________________________________________________________________________________________________________
Interrupt service routines are routines installed by the OS and device drivers that execute in response to a hardware interrupt signal.
Highest ISR routine execution time (µs): 105.422842
Driver with highest ISR routine execution time: USBPORT.SYS - USB 1.1 & 2.0 Port Driver, Microsoft Corporation
Highest reported total ISR routine time (%): 0.213458
Driver with highest ISR total time: USBPORT.SYS - USB 1.1 & 2.0 Port Driver, Microsoft Corporation
Total time spent in ISRs (%) 0.270381
ISR count (execution time <250 µs): 884727
ISR count (execution time 250-500 µs): 0
ISR count (execution time 500-999 µs): 0
ISR count (execution time 1000-1999 µs): 0
ISR count (execution time 2000-3999 µs): 0
ISR count (execution time >=4000 µs): 0
_________________________________________________________________________________________________________
REPORTED DPCs
_________________________________________________________________________________________________________
DPC routines are part of the interrupt servicing dispatch mechanism and disable the possibility for a process to utilize the CPU while it is interrupted until the DPC has finished execution.
Highest DPC routine execution time (µs): 589.018745
Driver with highest DPC routine execution time: ndis.sys - NDIS 6.20 driver, Microsoft Corporation
Highest reported total DPC routine time (%): 3.004338
Driver with highest DPC total execution time: USBPORT.SYS - USB 1.1 & 2.0 Port Driver, Microsoft Corporation
Total time spent in DPCs (%) 3.725055
DPC count (execution time <250 µs): 3347610
DPC count (execution time 250-500 µs): 0
DPC count (execution time 500-999 µs): 2349
DPC count (execution time 1000-1999 µs): 0
DPC count (execution time 2000-3999 µs): 0
DPC count (execution time >=4000 µs): 0
_________________________________________________________________________________________________________
REPORTED HARD PAGEFAULTS
_________________________________________________________________________________________________________
Hard pagefaults are events that get triggered by making use of virtual memory that is not resident in RAM but backed by a memory mapped file on disk. The process of resolving the hard pagefault requires reading in the memory from disk while the process is interrupted and blocked from execution.
NOTE: some processes were hit by hard pagefaults. If these were programs producing audio, they are likely to interrupt the audio stream resulting in dropouts, clicks and pops. Check the Processes tab to see which programs were hit.
Process with highest pagefault count: worldoftanks.exe
Total number of hard pagefaults 107
Hard pagefault count of hardest hit process: 50
Number of processes hit: 4
_________________________________________________________________________________________________________
PER CPU DATA
_________________________________________________________________________________________________________
CPU 0 Interrupt cycle time (s): 58.860802
CPU 0 ISR highest execution time (µs): 105.422842
CPU 0 ISR total execution time (s): 3.381980
CPU 0 ISR count: 833057
CPU 0 DPC highest execution time (µs): 589.018745
CPU 0 DPC total execution time (s): 47.176945
CPU 0 DPC count: 3181209
_________________________________________________________________________________________________________
CPU 1 Interrupt cycle time (s): 12.702884
CPU 1 ISR highest execution time (µs): 44.898431
CPU 1 ISR total execution time (s): 0.260151
CPU 1 ISR count: 51670
CPU 1 DPC highest execution time (µs): 481.518309
CPU 1 DPC total execution time (s): 2.926328
CPU 1 DPC count: 161456
_________________________________________________________________________________________________________
CPU 2 Interrupt cycle time (s): 3.206298
CPU 2 ISR highest execution time (µs): 0.0
CPU 2 ISR total execution time (s): 0.0
CPU 2 ISR count: 0
CPU 2 DPC highest execution time (µs): 83.933740
CPU 2 DPC total execution time (s): 0.044201
CPU 2 DPC count: 4042
_________________________________________________________________________________________________________
CPU 3 Interrupt cycle time (s): 3.479079
CPU 3 ISR highest execution time (µs): 0.0
CPU 3 ISR total execution time (s): 0.0
CPU 3 ISR count: 0
CPU 3 DPC highest execution time (µs): 107.526155
CPU 3 DPC total execution time (s): 0.030352
CPU 3 DPC count: 3252
_________________________________________________________________________________________________________
Attached Thumbnails


#52
Posted 21 November 2018 - 09:57 PM
darkmj16
- Topic Starter
-
- Member
-
- 194 posts
Member
I am seeing signs that you may need a BIOS update tho you have one from this year. What make and model and service tag is your PC?
it is a dell inspiron 17R. 4L28H22 is the tag and ya i just updated my bios few weeks ago with i think its a11.
#53
Posted 22 November 2018 - 06:49 AM
RKinner
-
- Expert
-
- 24,625 posts
Malware Expert
Please try it in Safe Mode. At least World of tanks won't be running.
What do you have plugged into USB ports? Lot of traffic on them.
#54
Posted 23 November 2018 - 11:40 PM
darkmj16
- Topic Starter
-
- Member
-
- 194 posts
Member
WoT i purposely was running since i play that often. the only thing i have plugged in is my logitech wireless mouse. but if i remember correctly i think some things are on the usb bus, like webcam and network card? i could be wrong. i dont remember.
i booted into safe mode. open lanMon and got (driver did not load due to windows booting into safe mode" error. click ok program starts i go to click monitor and get a this error (see pic). ran both as admin and non admin. same errors.
im not opposed to ditching AVG. its the free edition and as long as i can have a same or better free anti virus ill switch. AVG ive been hearing isnt as good as it use to be and is becoming a resource hog.
Attached Thumbnails

Edited by darkmj16, 23 November 2018 - 11:41 PM.
#55
Posted 26 November 2018 - 11:01 AM
RKinner
-
- Expert
-
- 24,625 posts
Malware Expert
I've just had two other Win 7 systems run Latency Monitor in Safe Mode so not sure why it fails for you.
Let's try the free Avast:
https://support.avas...-Free-Antivirus
Download the program. Uninstall AVG, reboot then install the program per the instructions on the page. Avoid optional software and stick with the free (Basic) version and avoid
Free Trials. Also don't let it speed up your PC or clean your browser. Opt out of the Avast Secure Browser if you can. Otherwise uninstall.
Once you have it installed let's try Latency Monitor again (without WoT or anything else running)
Tonight run a boot-time scan with Avast. It takes like 6 hours so I usually let it run at night.
Click on the Avast ball. Then click on Protection, then on Antivirus, then on Other Scans then on Boot-time Scan. Click on Install Special Definitions. Click on Run on Next PC Reboot.
Reboot and let it run a scan. It may take hours.
Once it finishes it should load windows. Mute your speakers so it doesn't wake you up when Windows boots.
When you reboot you will see the scan start. It will tell you where it saves its log. Usually it's C:\ProgramData\AVAST Software\Avast\report\aswBoot.txt but it might change so verify the location. This is a hidden location so you will need to tell Windows to let you see it:
http://www.howtogeek...-windows-vista/
Copy and paste the text from the log to a Reply when done.
#56
Posted 28 November 2018 - 07:35 PM
darkmj16
- Topic Starter
-
- Member
-
- 194 posts
Member
sorry for the delay. ive come down with a cold so havent really been doing much after work. but heres the avast boot report.
11/27/2018 23:31
Scan of C:
Scan of *STARTUP
File C:\ProgramData\SupportAssist\Client\Agent\Downloads\463dd7d7-4560-4eea-9216-f87e0e7e765b\iMEI_Intel_W74_X01_A00_Setup-N3JDN_ZPE.exe|>DIFxAPI.dll Error 42125 {ZIP archive is corrupted.}
Number of searched folders: 32382
Number of tested files: 1420770
Number of infected files: 0
#57
Posted 28 November 2018 - 08:08 PM
RKinner
-
- Expert
-
- 24,625 posts
Malware Expert
Delays are no problem. I don't keep track. Hope you are feeling better.
The Avast scan says you had a bad download of the Intel Management Engine Interface Driver. You might want to try downloading it again from your PC maker's support page.
How are things running now?
#58
Posted 01 December 2018 - 04:09 AM
darkmj16
- Topic Starter
-
- Member
-
- 194 posts
Member
ty. and i re downloaded the driver, read that driver descrip, it seems thats my problem. if i understand it correctly it kind of controls all the intel stuff and well... intel has a program for all the hardware on this laptop. however i seem to be having a problem getting it to install/work. ive redownloaded it 3 times now. ive tried to install it 6 times ish. and then it has actually install 3 times (after each attempt/install i did a uninstall and clean up of the files so itll start fresh) but after it does manage to install i go to open the program that comes with the driver and it says (program stopped unexpectedly please close program) so i guess theres an issue there. but my sound quilty is way worst still on bluetooth. start up is back to being fast, both before and after this driver install. but shutdown is still in the 4-5min range.
o heres some logs. i did a lanmon and hdtune. please note the WoT process you see is just the updater, like any program updater. its not the actual game running. the updater i thought was just a small no harm task so i left it. but i can disable it if you would like me to.
_________________________________________________________________________________________________________
CONCLUSION
_________________________________________________________________________________________________________
Your system appears to be having trouble handling real-time audio and other tasks. You are likely to experience buffer underruns appearing as drop outs, clicks or pops. One problem may be related to power management, disable CPU throttling settings in Control Panel and BIOS setup. Check for BIOS updates.
LatencyMon has been analyzing your system for 0:04:41 (h:mm:ss) on all processors.
_________________________________________________________________________________________________________
SYSTEM INFORMATION
_________________________________________________________________________________________________________
Computer name: USER-PC
OS version: Windows 7 Service Pack 1, 6.1, build: 7601 (x64)
Hardware: Inspiron 5737, Dell Inc., 073H4P
CPU: GenuineIntel Intel® Core™ i5-4200U CPU @ 1.60GHz
Logical processors: 4
Processor groups: 1
RAM: 8080 MB total
_________________________________________________________________________________________________________
CPU SPEED
_________________________________________________________________________________________________________
Reported CPU speed: 2294 MHz
Note: reported execution times may be calculated based on a fixed reported CPU speed. Disable variable speed settings like Intel Speed Step and AMD Cool N Quiet in the BIOS setup for more accurate results.
_________________________________________________________________________________________________________
MEASURED INTERRUPT TO USER PROCESS LATENCIES
_________________________________________________________________________________________________________
The interrupt to process latency reflects the measured interval that a usermode process needed to respond to a hardware request from the moment the interrupt service routine started execution. This includes the scheduling and execution of a DPC routine, the signaling of an event and the waking up of a usermode thread from an idle wait state in response to that event.
Highest measured interrupt to process latency (µs): 15083.227501
Average measured interrupt to process latency (µs): 9.035330
Highest measured interrupt to DPC latency (µs): 88.800990
Average measured interrupt to DPC latency (µs): 1.186389
_________________________________________________________________________________________________________
REPORTED ISRs
_________________________________________________________________________________________________________
Interrupt service routines are routines installed by the OS and device drivers that execute in response to a hardware interrupt signal.
Highest ISR routine execution time (µs): 61.993025
Driver with highest ISR routine execution time: ACPI.sys - ACPI Driver for NT, Microsoft Corporation
Highest reported total ISR routine time (%): 0.002326
Driver with highest ISR total time: hal.dll - Hardware Abstraction Layer DLL, Microsoft Corporation
Total time spent in ISRs (%) 0.002889
ISR count (execution time <250 µs): 9550
ISR count (execution time 250-500 µs): 0
ISR count (execution time 500-999 µs): 0
ISR count (execution time 1000-1999 µs): 0
ISR count (execution time 2000-3999 µs): 0
ISR count (execution time >=4000 µs): 0
_________________________________________________________________________________________________________
REPORTED DPCs
_________________________________________________________________________________________________________
DPC routines are part of the interrupt servicing dispatch mechanism and disable the possibility for a process to utilize the CPU while it is interrupted until the DPC has finished execution.
Highest DPC routine execution time (µs): 187.564080
Driver with highest DPC routine execution time: ndis.sys - NDIS 6.20 driver, Microsoft Corporation
Highest reported total DPC routine time (%): 0.075893
Driver with highest DPC total execution time: iaStorA.sys - Intel® Rapid Storage Technology driver - x64, Intel Corporation
Total time spent in DPCs (%) 0.156770
DPC count (execution time <250 µs): 258990
DPC count (execution time 250-500 µs): 0
DPC count (execution time 500-999 µs): 0
DPC count (execution time 1000-1999 µs): 0
DPC count (execution time 2000-3999 µs): 0
DPC count (execution time >=4000 µs): 0
_________________________________________________________________________________________________________
REPORTED HARD PAGEFAULTS
_________________________________________________________________________________________________________
Hard pagefaults are events that get triggered by making use of virtual memory that is not resident in RAM but backed by a memory mapped file on disk. The process of resolving the hard pagefault requires reading in the memory from disk while the process is interrupted and blocked from execution.
NOTE: some processes were hit by hard pagefaults. If these were programs producing audio, they are likely to interrupt the audio stream resulting in dropouts, clicks and pops. Check the Processes tab to see which programs were hit.
Process with highest pagefault count: svchost.exe
Total number of hard pagefaults 33137
Hard pagefault count of hardest hit process: 20757
Number of processes hit: 12
_________________________________________________________________________________________________________
PER CPU DATA
_________________________________________________________________________________________________________
CPU 0 Interrupt cycle time (s): 1.249673
CPU 0 ISR highest execution time (µs): 54.399303
CPU 0 ISR total execution time (s): 0.026922
CPU 0 ISR count: 9033
CPU 0 DPC highest execution time (µs): 187.564080
CPU 0 DPC total execution time (s): 0.328097
CPU 0 DPC count: 81977
_________________________________________________________________________________________________________
CPU 1 Interrupt cycle time (s): 4.571580
CPU 1 ISR highest execution time (µs): 61.993025
CPU 1 ISR total execution time (s): 0.005554
CPU 1 ISR count: 517
CPU 1 DPC highest execution time (µs): 164.056670
CPU 1 DPC total execution time (s): 1.412148
CPU 1 DPC count: 170477
_________________________________________________________________________________________________________
CPU 2 Interrupt cycle time (s): 0.293449
CPU 2 ISR highest execution time (µs): 0.0
CPU 2 ISR total execution time (s): 0.0
CPU 2 ISR count: 0
CPU 2 DPC highest execution time (µs): 112.067132
CPU 2 DPC total execution time (s): 0.021742
CPU 2 DPC count: 6482
_________________________________________________________________________________________________________
CPU 3 Interrupt cycle time (s): 0.175498
CPU 3 ISR highest execution time (µs): 0.0
CPU 3 ISR total execution time (s): 0.0
CPU 3 ISR count: 0
CPU 3 DPC highest execution time (µs): 19.068875
CPU 3 DPC total execution time (s): 0.000140
CPU 3 DPC count: 54
_________________________________________________________________________________________________________
Attached Thumbnails


#59
Posted 01 December 2018 - 05:51 AM
RKinner
-
- Expert
-
- 24,625 posts
Malware Expert
The intel program is probably not that critical. It's used in large corporations to remote control PCs. You can live without it but you need to go into the BIOS and turn it off if you uninstall it.
I see trustedinstaller running so your system is in the process of getting an upgrade. Things should look a bit different in an hour or so. The SVChost processes may be related or they may be something else.
The only way I have of seeing what each does is a combination of the Process Explorer log and the junk file:
Get Process Explorer
https://live.sysinte...com/procexp.exe
Save it to your desktop then run it (Vista or Win7+ - right click and Run As Administrator).
View, Select Column, check Verified Signer, OK
Options, Verify Image Signatures
Click twice on the CPU column header to sort things by CPU usage with the big hitters at the top.
Wait a full minute then:
File, Save As, Save. Note the file name. Open the file on your desktop and copy and paste the text to a reply.
Copy the next 2 lines:
TASKLIST /SVC > \junk.txt
notepad \junk.txt
Open an Elevated Command Prompt:
Win 7: Start, All Programs, Accessories then right click on Command Prompt and Run as Administrator
Win 8: http://www.eightforu...indows-8-a.html
win 10: http://www.howtogeek...-in-windows-10/
Right click and Paste (or Edit then Paste) and the copied lines should appear.
Hit Enter if notepad does not open. Copy and paste the text from notepad into a reply.
#60
Posted 01 December 2018 - 05:55 AM
RKinner
-
- Expert
-
- 24,625 posts
Malware Expert
Managed to get myself hung in the quote and couldn't type anything else. Stupid forum software.
I was wondering if your delays are from a task. Search for
task scheduler
hit Enter.
Click on the Task Scheduler Library and look in the next pane. Right click on each task and Disable. Then Reboot. One of the tasks may be the cause of your delays in starting and stopping but the change only takes effect after the reboot. So look to see if it starts faster or shutdowns faster (on the second shutdown)


Similar Topics
0 user(s) are reading this topic
0 members, 0 guests, 0 anonymous users
As Featured On:


 Sign In
 Create Account
