Jump to content

Welcome to Geeks to Go - Register now for FREE

Need help with your computer or device? Want to learn new tech skills? You're in the right place!
Geeks to Go is a friendly community of tech experts who can solve any problem you have. Just create a free account and post your question. Our volunteers will reply quickly and guide you through the steps. Don't let tech troubles stop you. Join Geeks to Go now and get the support you need!

How it Works Create Account
Photo

For rkinner


  • Please log in to reply

#31
RKinner

RKinner

    Malware Expert

  • Expert
  • 24,622 posts
  • MVP

I expect it's a program getting in our way rather than a drive problem.


Get

Latency Monitor:

Go to

http://www.resplendence.com/downloads

Scroll down to

System Monitoring Tools

and then find

LatencyMon 6.70 (or it may be a higher number if they update)

Click on Download free home edition

Save it then right click and Run As Admin.  It will install and then start the program.  
It will tell you to click on the Start button but there isn't one.  
Instead click on the green arrowhead (looks like a Play button).   Start the HD Tune test again.  Wait until HD Tune stops.  Then hit the red box to stop Latency Monitor.

Edit, Copy Report text to Clipboard then move to a REPLY and Ctrl + v to paste the text into a reply.


  • 0

Advertisements


#32
louuu

louuu

    Member

  • Topic Starter
  • Member
  • PipPipPip
  • 260 posts
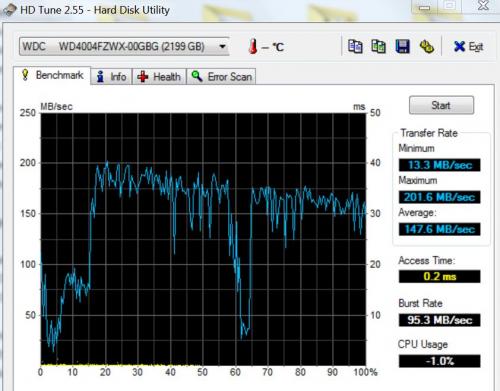
here is the info you requested and i also posted a pic of the latest hd tunes in case you want to see it, thanks.
 
 
_________________________________________________________________________________________________________
CONCLUSION
_________________________________________________________________________________________________________
Your system appears to be having trouble handling real-time audio and other tasks. You are likely to experience buffer underruns appearing as drop outs, clicks or pops. One or more DPC routines that belong to a driver running in your system appear to be executing for too long. At least one detected problem appears to be network related. In case you are using a WLAN adapter, try disabling it to get better results. One problem may be related to power management, disable CPU throttling settings in Control Panel and BIOS setup. Check for BIOS updates. 
LatencyMon has been analyzing your system for  0:04:11  (h:mm:ss) on all processors.
 
 
_________________________________________________________________________________________________________
SYSTEM INFORMATION
_________________________________________________________________________________________________________
Computer name:                                        LUIS8500
OS version:                                           Windows 7 Service Pack 1, 6.1, build: 7601 (x64)
Hardware:                                             XPS 8500  , Dell Inc., 0YJPT1
CPU:                                                  GenuineIntel Intel® Core™ i7-3770 CPU @ 3.40GHz
Logical processors:                                   8
Processor groups:                                     1
RAM:                                                  16344 MB total
 
 
_________________________________________________________________________________________________________
CPU SPEED
_________________________________________________________________________________________________________
Reported CPU speed:                                   3395 MHz
 
Note: reported execution times may be calculated based on a fixed reported CPU speed. Disable variable speed settings like Intel Speed Step and AMD Cool N Quiet in the BIOS setup for more accurate results.
 
WARNING: the CPU speed that was measured is only a fraction of the CPU speed reported. Your CPUs may be throttled back due to variable speed settings and thermal issues. It is suggested that you run a utility which reports your actual CPU frequency and temperature. 


_________________________________________________________________________________________________________
MEASURED INTERRUPT TO USER PROCESS LATENCIES
_________________________________________________________________________________________________________
The interrupt to process latency reflects the measured interval that a usermode process needed to respond to a hardware request from the moment the interrupt service routine started execution. This includes the scheduling and execution of a DPC routine, the signaling of an event and the waking up of a usermode thread from an idle wait state in response to that event.
 
Highest measured interrupt to process latency (µs):   3185.384684
Average measured interrupt to process latency (µs):   3.028667
 
Highest measured interrupt to DPC latency (µs):       246.978137
Average measured interrupt to DPC latency (µs):       0.718056
 
 
_________________________________________________________________________________________________________
 REPORTED ISRs
_________________________________________________________________________________________________________
Interrupt service routines are routines installed by the OS and device drivers that execute in response to a hardware interrupt signal.
 
Highest ISR routine execution time (µs):              115.242415
Driver with highest ISR routine execution time:       dxgkrnl.sys - DirectX Graphics Kernel, Microsoft Corporation
 
Highest reported total ISR routine time (%):          0.016844
Driver with highest ISR total time:                   dxgkrnl.sys - DirectX Graphics Kernel, Microsoft Corporation
 
Total time spent in ISRs (%)                          0.032034
 
ISR count (execution time <250 µs):                   252918
ISR count (execution time 250-500 µs):                0
ISR count (execution time 500-999 µs):                0
ISR count (execution time 1000-1999 µs):              0
ISR count (execution time 2000-3999 µs):              0
ISR count (execution time >=4000 µs):                 0
 
 
_________________________________________________________________________________________________________
REPORTED DPCs
_________________________________________________________________________________________________________
DPC routines are part of the interrupt servicing dispatch mechanism and disable the possibility for a process to utilize the CPU while it is interrupted until the DPC has finished execution.
 
Highest DPC routine execution time (µs):              10573.538733
Driver with highest DPC routine execution time:       tcpip.sys - TCP/IP Driver, Microsoft Corporation
 
Highest reported total DPC routine time (%):          0.161460
Driver with highest DPC total execution time:         rspLLL64.sys - Resplendence Latency Monitoring and Auxiliary Kernel Library, Resplendence Software Projects Sp.
 
Total time spent in DPCs (%)                          0.224884
 
DPC count (execution time <250 µs):                   1656395
DPC count (execution time 250-500 µs):                0
DPC count (execution time 500-999 µs):                0
DPC count (execution time 1000-1999 µs):              0
DPC count (execution time 2000-3999 µs):              0
DPC count (execution time >=4000 µs):                 0
 
 
_________________________________________________________________________________________________________
 REPORTED HARD PAGEFAULTS
_________________________________________________________________________________________________________
Hard pagefaults are events that get triggered by making use of virtual memory that is not resident in RAM but backed by a memory mapped file on disk. The process of resolving the hard pagefault requires reading in the memory from disk while the process is interrupted and blocked from execution.
 
NOTE: some processes were hit by hard pagefaults. If these were programs producing audio, they are likely to interrupt the audio stream resulting in dropouts, clicks and pops. Check the Processes tab to see which programs were hit.
 
Process with highest pagefault count:                 nis.exe
 
Total number of hard pagefaults                       16
Hard pagefault count of hardest hit process:          8
Number of processes hit:                              3
 
 
_________________________________________________________________________________________________________
 PER CPU DATA
_________________________________________________________________________________________________________
CPU 0 Interrupt cycle time (s):                       4.897151
CPU 0 ISR highest execution time (µs):                86.306922
CPU 0 ISR total execution time (s):                   0.237321
CPU 0 ISR count:                                      195432
CPU 0 DPC highest execution time (µs):                10573.538733
CPU 0 DPC total execution time (s):                   0.902901
CPU 0 DPC count:                                      956770
_________________________________________________________________________________________________________
CPU 1 Interrupt cycle time (s):                       10.084160
CPU 1 ISR highest execution time (µs):                115.242415
CPU 1 ISR total execution time (s):                   0.373292
CPU 1 ISR count:                                      53461
CPU 1 DPC highest execution time (µs):                128.684242
CPU 1 DPC total execution time (s):                   2.982403
CPU 1 DPC count:                                      522668
_________________________________________________________________________________________________________
CPU 2 Interrupt cycle time (s):                       2.475653
CPU 2 ISR highest execution time (µs):                77.525479
CPU 2 ISR total execution time (s):                   0.003649
CPU 2 ISR count:                                      367
CPU 2 DPC highest execution time (µs):                79.313991
CPU 2 DPC total execution time (s):                   0.090047
CPU 2 DPC count:                                      33253
_________________________________________________________________________________________________________
CPU 3 Interrupt cycle time (s):                       4.325549
CPU 3 ISR highest execution time (µs):                65.028866
CPU 3 ISR total execution time (s):                   0.013940
CPU 3 ISR count:                                      1735
CPU 3 DPC highest execution time (µs):                138.920766
CPU 3 DPC total execution time (s):                   0.231264
CPU 3 DPC count:                                      40585
_________________________________________________________________________________________________________
CPU 4 Interrupt cycle time (s):                       2.885063
CPU 4 ISR highest execution time (µs):                58.123711
CPU 4 ISR total execution time (s):                   0.003168
CPU 4 ISR count:                                      359
CPU 4 DPC highest execution time (µs):                112.718704
CPU 4 DPC total execution time (s):                   0.090828
CPU 4 DPC count:                                      33665
_________________________________________________________________________________________________________
CPU 5 Interrupt cycle time (s):                       2.579383
CPU 5 ISR highest execution time (µs):                55.538144
CPU 5 ISR total execution time (s):                   0.005753
CPU 5 ISR count:                                      717
CPU 5 DPC highest execution time (µs):                93.663328
CPU 5 DPC total execution time (s):                   0.033946
CPU 5 DPC count:                                      5634
_________________________________________________________________________________________________________
CPU 6 Interrupt cycle time (s):                       2.422266
CPU 6 ISR highest execution time (µs):                51.334021
CPU 6 ISR total execution time (s):                   0.000157
CPU 6 ISR count:                                      16
CPU 6 DPC highest execution time (µs):                89.240648
CPU 6 DPC total execution time (s):                   0.001624
CPU 6 DPC count:                                      153
_________________________________________________________________________________________________________
CPU 7 Interrupt cycle time (s):                       3.257350
CPU 7 ISR highest execution time (µs):                68.809131
CPU 7 ISR total execution time (s):                   0.007167
CPU 7 ISR count:                                      831
CPU 7 DPC highest execution time (µs):                48.587040
CPU 7 DPC total execution time (s):                   0.191167
CPU 7 DPC count:                                      63668
_________________________________________________________________________________________________________
 

Attached Thumbnails

  • hd tune 2.JPG

  • 0

#33
RKinner

RKinner

    Malware Expert

  • Expert
  • 24,622 posts
  • MVP

Can you disable your network adapter then try both again?


  • 0

#34
louuu

louuu

    Member

  • Topic Starter
  • Member
  • PipPipPip
  • 260 posts

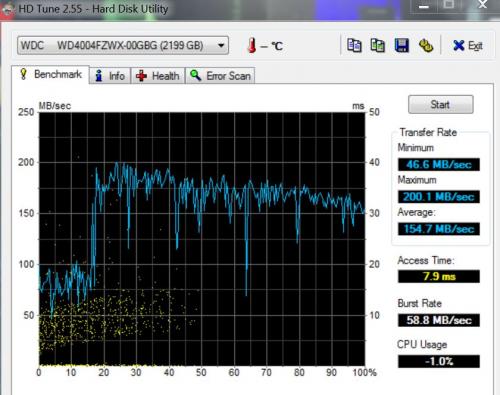
here is the info you requested with the network adapter disabled and i also posted a pic of the latest hd tunes in case you want to see it, thanks.


_________________________________________________________________________________________________________

CONCLUSION
_________________________________________________________________________________________________________
Your system appears to be suitable for handling real-time audio and other tasks without dropouts. 
LatencyMon has been analyzing your system for  0:03:51  (h:mm:ss) on all processors.
 
 
_________________________________________________________________________________________________________
SYSTEM INFORMATION
_________________________________________________________________________________________________________
Computer name:                                        LUIS8500
OS version:                                           Windows 7 Service Pack 1, 6.1, build: 7601 (x64)
Hardware:                                             XPS 8500  , Dell Inc., 0YJPT1
CPU:                                                  GenuineIntel Intel® Core™ i7-3770 CPU @ 3.40GHz
Logical processors:                                   8
Processor groups:                                     1
RAM:                                                  16344 MB total
 
 
_________________________________________________________________________________________________________
CPU SPEED
_________________________________________________________________________________________________________
Reported CPU speed:                                   3395 MHz
 
Note: reported execution times may be calculated based on a fixed reported CPU speed. Disable variable speed settings like Intel Speed Step and AMD Cool N Quiet in the BIOS setup for more accurate results.
 
WARNING: the CPU speed that was measured is only a fraction of the CPU speed reported. Your CPUs may be throttled back due to variable speed settings and thermal issues. It is suggested that you run a utility which reports your actual CPU frequency and temperature. 


_________________________________________________________________________________________________________
MEASURED INTERRUPT TO USER PROCESS LATENCIES
_________________________________________________________________________________________________________
The interrupt to process latency reflects the measured interval that a usermode process needed to respond to a hardware request from the moment the interrupt service routine started execution. This includes the scheduling and execution of a DPC routine, the signaling of an event and the waking up of a usermode thread from an idle wait state in response to that event.
 
Highest measured interrupt to process latency (µs):   848.586428
Average measured interrupt to process latency (µs):   5.900849
 
Highest measured interrupt to DPC latency (µs):       175.205656
Average measured interrupt to DPC latency (µs):       1.351869
 
 
_________________________________________________________________________________________________________
 REPORTED ISRs
_________________________________________________________________________________________________________
Interrupt service routines are routines installed by the OS and device drivers that execute in response to a hardware interrupt signal.
 
Highest ISR routine execution time (µs):              133.691605
Driver with highest ISR routine execution time:       HDAudBus.sys - High Definition Audio Bus Driver, Microsoft Corporation
 
Highest reported total ISR routine time (%):          0.011972
Driver with highest ISR total time:                   dxgkrnl.sys - DirectX Graphics Kernel, Microsoft Corporation
 
Total time spent in ISRs (%)                          0.020508
 
ISR count (execution time <250 µs):                   56188
ISR count (execution time 250-500 µs):                0
ISR count (execution time 500-999 µs):                0
ISR count (execution time 1000-1999 µs):              0
ISR count (execution time 2000-3999 µs):              0
ISR count (execution time >=4000 µs):                 0
 
 
_________________________________________________________________________________________________________
REPORTED DPCs
_________________________________________________________________________________________________________
DPC routines are part of the interrupt servicing dispatch mechanism and disable the possibility for a process to utilize the CPU while it is interrupted until the DPC has finished execution.
 
Highest DPC routine execution time (µs):              224.855376
Driver with highest DPC routine execution time:       nvlddmkm.sys - NVIDIA Windows Kernel Mode Driver, Version 416.34 , NVIDIA Corporation
 
Highest reported total DPC routine time (%):          0.206498
Driver with highest DPC total execution time:         rspLLL64.sys - Resplendence Latency Monitoring and Auxiliary Kernel Library, Resplendence Software Projects Sp.
 
Total time spent in DPCs (%)                          0.26430
 
DPC count (execution time <250 µs):                   1028566
DPC count (execution time 250-500 µs):                0
DPC count (execution time 500-999 µs):                0
DPC count (execution time 1000-1999 µs):              0
DPC count (execution time 2000-3999 µs):              0
DPC count (execution time >=4000 µs):                 0
 
 
_________________________________________________________________________________________________________
 REPORTED HARD PAGEFAULTS
_________________________________________________________________________________________________________
Hard pagefaults are events that get triggered by making use of virtual memory that is not resident in RAM but backed by a memory mapped file on disk. The process of resolving the hard pagefault requires reading in the memory from disk while the process is interrupted and blocked from execution.
 
NOTE: some processes were hit by hard pagefaults. If these were programs producing audio, they are likely to interrupt the audio stream resulting in dropouts, clicks and pops. Check the Processes tab to see which programs were hit.
 
Process with highest pagefault count:                 nis.exe
 
Total number of hard pagefaults                       44
Hard pagefault count of hardest hit process:          21
Number of processes hit:                              5
 
 
_________________________________________________________________________________________________________
 PER CPU DATA
_________________________________________________________________________________________________________
CPU 0 Interrupt cycle time (s):                       1.406896
CPU 0 ISR highest execution time (µs):                90.985272
CPU 0 ISR total execution time (s):                   0.067994
CPU 0 ISR count:                                      14379
CPU 0 DPC highest execution time (µs):                224.855376
CPU 0 DPC total execution time (s):                   0.289173
CPU 0 DPC count:                                      74757
_________________________________________________________________________________________________________
CPU 1 Interrupt cycle time (s):                       2.393774
CPU 1 ISR highest execution time (µs):                78.893078
CPU 1 ISR total execution time (s):                   0.026569
CPU 1 ISR count:                                      3508
CPU 1 DPC highest execution time (µs):                169.184389
CPU 1 DPC total execution time (s):                   0.818270
CPU 1 DPC count:                                      167100
_________________________________________________________________________________________________________
CPU 2 Interrupt cycle time (s):                       0.866727
CPU 2 ISR highest execution time (µs):                81.151105
CPU 2 ISR total execution time (s):                   0.002644
CPU 2 ISR count:                                      309
CPU 2 DPC highest execution time (µs):                151.116937
CPU 2 DPC total execution time (s):                   0.054316
CPU 2 DPC count:                                      15936
_________________________________________________________________________________________________________
CPU 3 Interrupt cycle time (s):                       2.197342
CPU 3 ISR highest execution time (µs):                62.494256
CPU 3 ISR total execution time (s):                   0.023305
CPU 3 ISR count:                                      3077
CPU 3 DPC highest execution time (µs):                126.764654
CPU 3 DPC total execution time (s):                   0.736358
CPU 3 DPC count:                                      151104
_________________________________________________________________________________________________________
CPU 4 Interrupt cycle time (s):                       4.112773
CPU 4 ISR highest execution time (µs):                80.154345
CPU 4 ISR total execution time (s):                   0.070867
CPU 4 ISR count:                                      9758
CPU 4 DPC highest execution time (µs):                131.733137
CPU 4 DPC total execution time (s):                   0.985830
CPU 4 DPC count:                                      252942
_________________________________________________________________________________________________________
CPU 5 Interrupt cycle time (s):                       5.740508
CPU 5 ISR highest execution time (µs):                133.691605
CPU 5 ISR total execution time (s):                   0.177472
CPU 5 ISR count:                                      23810
CPU 5 DPC highest execution time (µs):                142.677172
CPU 5 DPC total execution time (s):                   1.685797
CPU 5 DPC count:                                      292081
_________________________________________________________________________________________________________
CPU 6 Interrupt cycle time (s):                       0.770532
CPU 6 ISR highest execution time (µs):                46.843594
CPU 6 ISR total execution time (s):                   0.001508
CPU 6 ISR count:                                      191
CPU 6 DPC highest execution time (µs):                132.338144
CPU 6 DPC total execution time (s):                   0.054522
CPU 6 DPC count:                                      19446
_________________________________________________________________________________________________________
CPU 7 Interrupt cycle time (s):                       2.200457
CPU 7 ISR highest execution time (µs):                92.939028
CPU 7 ISR total execution time (s):                   0.009040
CPU 7 ISR count:                                      1156
CPU 7 DPC highest execution time (µs):                79.434462
CPU 7 DPC total execution time (s):                   0.265419
CPU 7 DPC count:                                      55200
_________________________________________________________________________________________________________
 

Attached Thumbnails

  • hd tune 3.JPG

  • 0

#35
RKinner

RKinner

    Malware Expert

  • Expert
  • 24,622 posts
  • MVP

nis.exe is the current problem.  It's part of Norton.  You might be able to run Process Explorer and right click on it and Pause.


Turning off the network adapter helped a lot as far as Latency Monitor is concerned.  You may need a new network driver.  What adapter did you turn off?  Got to go to the dentist.  Will be off line for a few hours.


  • 0

#36
louuu

louuu

    Member

  • Topic Starter
  • Member
  • PipPipPip
  • 260 posts

nis.exe is my norton internet security that ive been using for over 15 years.  the last time i upgraded to a newer version was a few years ago because i read that if its running well theres no need to upgrade the version.  also im used to this versions layout and i know sometimes with a new version comes a new layout to learn.  right now there is an updated version available and if you feel i must upgrade to that newer current version i will but if you think its not necessary right now i rather stay with this version that im used to.


you asked what network adapter i turned off.  i went to control panel / network and sharing center and then on the left side i clicked on "change adapter settings" and then i right clicked on "local area connection' and hit disable.


you mentioned running process explorer and right clicking nis and hitting pause but i dont see process explorer and im not familiar with it or how to install/access it.  unless thats basically the same as task manager?  in task manager if i go under processes i see nis.exe and if i right click it the options are end process, end process tree and go to services.  if i got to services i see nis (not nis.exe) and if i right click it the options are stop service.  let me know how to proceed, thank you.


  • 0

#37
RKinner

RKinner

    Malware Expert

  • Expert
  • 24,622 posts
  • MVP

Get Process Explorer

https://live.sysinte...com/procexp.exe

Save it to your desktop then run it (Vista or Win7+ - right click and Run As Administrator).  

View, Select Column, check Verified Signer, OK
Options, Verify Image Signatures


Click twice on the CPU column header  to sort things by CPU usage with the big hitters at the top.  

Wait a full minute then:

File, Save As, Save.  Note the file name.   Open the file  on your desktop and copy and paste the text to a reply.


Get the free version of Speccy:

http://www.filehippo...ownload_speccy/ 

(Look in the upper right for the Download
Latest Version button  - Do NOT press the large Start Download button on the upper left!)  
Download, Save and Install it.  Tell it you do not need CCLEANER.    Run Speccy.  When it finishes (the little icon in the bottom left will stop moving),
File, Save as Text File,  (to your desktop) note the name it gives. OK.  Open the file in notepad and delete the line that gives the serial number of your Operating System.  
(It will be near the top,  10-20  lines down.) Save the file.  Attach the file to your next post.  Attaching the log is the best option as it is too big for the forum.  Attaching is a multi step process.

First click on More Reply Options
Then scroll down to where you see
Choose File and click on it.  Point it at the file and hit Open.
Now click on Attach this file.


If Norton is causing page faults it is probably time to upgrade.


  • 0

#38
louuu

louuu

    Member

  • Topic Starter
  • Member
  • PipPipPip
  • 260 posts

hope your dentist visit went ok.

1. the process explorer text is below.

2. the speccy text is attached to this post as per your request because its too big to copy/paste.

3. you said "If Norton is causing page faults it is probably time to upgrade".  is it still causing page faults?  if you tell me to upgrade it i will but i need to know if you are telling me to do it right now, thanks.


Process CPU Private Bytes Working Set PID Description Company Name Verified Signer

System Idle Process 97.57 0 K 24 K 0
procexp64.exe 0.59 39,440 K 60,284 K 6732 Sysinternals Process Explorer Sysinternals - www.sysinternals.com (Verified) Microsoft Corporation
System 0.45 128 K 324 K 4
CMServer.exe 0.20 28,028 K 29,444 K 3560 DigiPortal Software, Inc. (No signature was present in the subject) DigiPortal Software, Inc.
Interrupts 0.19 0 K 0 K n/a Hardware Interrupts and DPCs
EVGAPrecision.exe 0.18 8,180 K 5,072 K 2192 EVGAPrecision (Verified) EVGA
svchost.exe 0.16 6,972 K 12,852 K 1000 Host Process for Windows Services Microsoft Corporation (Verified) Microsoft Windows
explorer.exe 0.13 95,652 K 126,840 K 1148 Windows Explorer Microsoft Corporation (Verified) Microsoft Windows
ReflectMonitor.exe 0.11 5,204 K 13,764 K 3388 Macrium Reflect Disk Imaging and Backup Paramount Software UK Ltd (Verified) Paramount Software UK Ltd
dwm.exe 0.07 57,728 K 43,896 K 1420 Desktop Window Manager Microsoft Corporation (Verified) Microsoft Windows
svchost.exe 0.06 12,536 K 22,700 K 1064 Host Process for Windows Services Microsoft Corporation (Verified) Microsoft Windows
MBAMService.exe 0.05 173,224 K 209,272 K 5404 Malwarebytes Service Malwarebytes (Verified) Malwarebytes Corporation
Core Temp.exe 0.05 13,492 K 2,424 K 2200 CPU temperature and system information utility (No signature was present in the subject)
chrome.exe 0.03 63,500 K 90,444 K 3160 Google Chrome Google Inc. (Verified) Google Inc
unchecky_bg.exe 0.02 3,296 K 10,032 K 4968 Unchecky Background Process Reason Software Company Inc. (Verified) Reason Software Company Inc.
csrss.exe 0.02 3,640 K 18,784 K 784 Client Server Runtime Process Microsoft Corporation (Verified) Microsoft Windows
nvcontainer.exe 0.02 13,140 K 30,488 K 3064 NVIDIA Container NVIDIA Corporation (Verified) NVIDIA Corporation
nis.exe 0.02 255,588 K 211,568 K 2988 Norton Internet Security Symantec Corporation (Verified) Symantec Corporation
mdm.exe 0.01 2,676 K 6,912 K 2800 Machine Debug Manager Microsoft Corporation (No signature was present in the subject) Microsoft Corporation
svchost.exe 0.01 8,172 K 14,492 K 2672 Host Process for Windows Services Microsoft Corporation (Verified) Microsoft Windows
ADVWindowsClientService.exe 0.01 42,984 K 41,540 K 3776 Amazon Unbox Video Service Amazon.com (Certificate expired) Amazon.com
chrome.exe 0.01 47,404 K 59,272 K 6220 Google Chrome Google Inc. (Verified) Google Inc
chrome.exe 0.01 108,888 K 182,380 K 8444 Google Chrome Google Inc. (Verified) Google Inc
ChoiceMailClient.exe 0.01 17,292 K 17,452 K 4032 DigiPortal Software, Inc. (No signature was present in the subject) DigiPortal Software, Inc.
ppped.exe < 0.01 6,816 K 11,880 K 3188 PowerPanel Personal Edition Service Cyber Power Systems, Inc. (Verified) Cyber Power Systems
PMA.exe < 0.01 3,820 K 10,036 K 9556 Epson ReadyInk Agent (A) Seiko Epson Corporation (Verified) SEIKO EPSON CORPORATION
chrome.exe < 0.01 43,644 K 60,160 K 10024 Google Chrome Google Inc. (Verified) Google Inc
SearchIndexer.exe < 0.01 31,248 K 22,780 K 6000 Microsoft Windows Search Indexer Microsoft Corporation (Verified) Microsoft Windows
chrome.exe < 0.01 42,320 K 58,080 K 6236 Google Chrome Google Inc. (Verified) Google Inc
NVIDIA Web Helper.exe < 0.01 28,412 K 6,948 K 5364 NVIDIA Web Helper Service Node.js (Verified) NVIDIA Corporation
csrss.exe < 0.01 2,920 K 5,472 K 636 Client Server Runtime Process Microsoft Corporation (Verified) Microsoft Windows
TeamViewer_Service.exe < 0.01 5,736 K 16,724 K 4816 TeamViewer 13 TeamViewer GmbH (Verified) TeamViewer GmbH
wlmail.exe < 0.01 80,000 K 103,876 K 2508 Windows Live Mail Microsoft Corporation (Verified) Microsoft Corporation
AppleMobileDeviceService.exe < 0.01 4,616 K 11,916 K 2176 MobileDeviceService Apple Inc. (Verified) Apple Inc.
svchost.exe < 0.01 30,332 K 32,972 K 1396 Host Process for Windows Services Microsoft Corporation (Verified) Microsoft Windows
nvcontainer.exe < 0.01 11,988 K 25,576 K 5532 NVIDIA Container NVIDIA Corporation (Verified) NVIDIA Corporation
wlcomm.exe < 0.01 19,228 K 13,340 K 4536 Windows Live Communications Platform Microsoft Corporation (Verified) Microsoft Corporation
novacomd.exe < 0.01 2,872 K 5,920 K 3032 novacomd Application Palm (No signature was present in the subject) Palm
taskhost.exe < 0.01 15,284 K 17,744 K 1888 Host Process for Windows Tasks Microsoft Corporation (Verified) Microsoft Windows
svchost.exe < 0.01 28,988 K 27,304 K 776 Host Process for Windows Services Microsoft Corporation (Verified) Microsoft Windows
svchost.exe < 0.01 5,988 K 10,356 K 584 Host Process for Windows Services Microsoft Corporation (Verified) Microsoft Windows
svchost.exe < 0.01 36,912 K 55,588 K 1088 Host Process for Windows Services Microsoft Corporation (Verified) Microsoft Windows
nis.exe < 0.01 19,016 K 10,236 K 2936 Norton Internet Security Symantec Corporation (Verified) Symantec Corporation
chrome.exe < 0.01 44,108 K 59,680 K 4692 Google Chrome Google Inc. (Verified) Google Inc
chrome.exe < 0.01 189,956 K 121,076 K 9452 Google Chrome Google Inc. (Verified) Google Inc
svchost.exe < 0.01 401,412 K 407,868 K 1040 Host Process for Windows Services Microsoft Corporation (Verified) Microsoft Windows
ChoiceMailClient.exe < 0.01 6,388 K 14,812 K 3900 DigiPortal Software, Inc. (No signature was present in the subject) DigiPortal Software, Inc.
NvTelemetryContainer.exe < 0.01 5,808 K 13,532 K 3104 NVIDIA Container NVIDIA Corporation (Verified) NVIDIA Corporation
NVDisplay.Container.exe < 0.01 26,636 K 43,112 K 972 NVIDIA Container NVIDIA Corporation (Verified) NVIDIA Corporation
CMServer.exe < 0.01 4,964 K 9,068 K 3496 DigiPortal Software, Inc. (No signature was present in the subject) DigiPortal Software, Inc.
spoolsv.exe < 0.01 9,188 K 16,384 K 1744 Spooler SubSystem App Microsoft Corporation (Verified) Microsoft Windows
svchost.exe < 0.01 13,872 K 18,816 K 1556 Host Process for Windows Services Microsoft Corporation (Verified) Microsoft Windows
AdminService.exe < 0.01 2,928 K 6,364 K 2344 AdminService Application Atheros Commnucations (Certificate expired) Atheros Commnucations
WUDFHost.exe 2,664 K 7,308 K 6388 Windows Driver Foundation - User-mode Driver Framework Host Process Microsoft Corporation (Verified) Microsoft Windows
WmiPrvSE.exe 3,504 K 8,076 K 9104 WMI Provider Host Microsoft Corporation (Verified) Microsoft Windows
wlanext.exe 2,828 K 6,516 K 1616 Windows Wireless LAN 802.11 Extensibility Framework Microsoft Corporation (Verified) Microsoft Windows
winlogon.exe 4,256 K 9,096 K 868 Windows Logon Application Microsoft Corporation (Verified) Microsoft Windows
wininit.exe 2,508 K 5,640 K 792 Windows Start-Up Application Microsoft Corporation (Verified) Microsoft Windows
vds.exe 2,096 K 6,204 K 4956 Virtual Disk Service Microsoft Corporation (Verified) Microsoft Windows
unchecky_svc.exe 2,692 K 7,072 K 4896 Unchecky Service Reason Software Company Inc. (Verified) Reason Software Company Inc.
UMVPFSrv.exe 1,332 K 5,292 K 1132 Logitech User mode UMVPF service Logitech Inc. (Verified) Logitech
taskeng.exe 3,388 K 8,024 K 2092 Task Scheduler Engine Microsoft Corporation (Verified) Microsoft Windows
svchost.exe 21,440 K 24,756 K 5360 Host Process for Windows Services Microsoft Corporation (Verified) Microsoft Windows
svchost.exe 3,820 K 7,428 K 1228 Host Process for Windows Services Microsoft Corporation (Verified) Microsoft Windows
svchost.exe 2,272 K 5,648 K 5000 Host Process for Windows Services Microsoft Corporation (Verified) Microsoft Windows
svchost.exe 2,700 K 6,844 K 6284 Host Process for Windows Services Microsoft Corporation (Verified) Microsoft Windows
svchost.exe 2,424 K 6,492 K 3472 Host Process for Windows Services Microsoft Corporation (Verified) Microsoft Windows
svchost.exe 7,456 K 12,952 K 2464 Host Process for Windows Services Microsoft Corporation (Verified) Microsoft Windows
smss.exe 744 K 1,552 K 412 Windows Session Manager Microsoft Corporation (Verified) Microsoft Windows
services.exe 7,088 K 13,332 K 860 Services and Controller app Microsoft Corporation (Verified) Microsoft Windows
RtkAudioService64.exe 2,728 K 6,404 K 1328 Realtek Audio Service Realtek Semiconductor (Verified) Realtek Semiconductor Corp
ReflectUI.exe 9,980 K 21,780 K 3336 Macrium Reflect UI Watcher Paramount Software UK Ltd (Verified) Paramount Software UK Ltd
RAVBg64.exe 16,240 K 13,880 K 1352 HD Audio Background Process Realtek Semiconductor (Verified) Realtek Semiconductor Corp
procexp.exe 2,548 K 7,836 K 6528 Sysinternals Process Explorer Sysinternals - www.sysinternals.com (Verified) Microsoft Corporation
PMAService.exe 1,824 K 6,876 K 2600 Epson ReadyInk Agent Seiko Epson Corporation (Verified) SEIKO EPSON CORPORATION
NVDisplay.Container.exe 8,420 K 16,164 K 2916 NVIDIA Container NVIDIA Corporation (Verified) NVIDIA Corporation
NBService.exe 3,320 K 9,492 K 2868 Nero BackItUp Nero AG (Verified) Nero AG
mDNSResponder.exe 3,472 K 7,268 K 2372 Bonjour Service Apple Inc. (Verified) Apple Inc.
mbamtray.exe 25,788 K 40,200 K 4640 Malwarebytes Tray Application Malwarebytes (Verified) Malwarebytes Corporation
MacriumService.exe 70,928 K 78,132 K 2700 Macrium Reflect Utility Service Paramount Software UK Ltd (Verified) Paramount Software UK Ltd
lsm.exe 3,116 K 5,116 K 888 Local Session Manager Service Microsoft Corporation (Verified) Microsoft Windows
lsass.exe 7,064 K 14,736 K 880 Local Security Authority Process Microsoft Corporation (Verified) Microsoft Windows
IntuitUpdateService.exe 24,532 K 1,836 K 968 Intuit Update Service Intuit Inc. (Verified) Intuit
IAStorIcon.exe 25,952 K 33,676 K 3172 IAStorIcon Intel Corporation (Verified) Intel® Rapid Storage Technology
IAStorDataMgrSvc.exe 42,808 K 54,716 K 2880 IAStorDataSvc Intel Corporation (Verified) Intel® Rapid Storage Technology
escsvc64.exe 2,112 K 4,548 K 2648 Epson Scanner Service (64bit) Seiko Epson Corporation (Verified) SEIKO EPSON Corporation
conhost.exe 1,480 K 3,560 K 1628 Console Window Host Microsoft Corporation (Verified) Microsoft Windows
conhost.exe 2,052 K 4,596 K 6984 Console Window Host Microsoft Corporation (Verified) Microsoft Windows
CMPreapproval.exe 7,028 K 12,328 K 3456 DigiPortal Software, Inc (No signature was present in the subject) DigiPortal Software, Inc
chrome.exe 23,948 K 30,344 K 8372 Google Chrome Google Inc. (Verified) Google Inc
chrome.exe 3,412 K 7,052 K 8592 Google Chrome Google Inc. (Verified) Google Inc
chrome.exe 3,788 K 8,064 K 1448 Google Chrome Google Inc. (Verified) Google Inc
CASPERSVCS.EXE 2,864 K 7,148 K 2400 Casper Utility and Support Services Future Systems Solutions, Inc. (Verified) Future Systems Solutions
audiodg.exe 23,168 K 24,804 K 9860 Windows Audio Device Graph Isolation Microsoft Corporation (Verified) Microsoft Windows
Ath_WlanAgent.exe 1,408 K 4,892 K 5088 Atheros Coex Service Application Atheros (Certificate expired) Atheros
Ath_CoexAgent.exe 2,084 K 6,464 K 5040 Atheros Coex Service Application Atheros (Certificate expired) Atheros
armsvc.exe 1,348 K 5,080 K 1956 Adobe Acrobat Update Service Adobe Systems Incorporated (Verified) Adobe Systems
agr64svc.exe 1,572 K 3,576 K 2120 LSI Soft Modem Call Progress Service LSI Corporation (Verified) LSI Corporation
AffinegyService.exe 2,604 K 9,312 K 1380 AffinegyService Affinegy, Inc. (Verified) Affinegy
AERTSr64.exe 1,852 K 3,764 K 1060 Andrea filters APO access service (64-bit) Andrea Electronics Corporation (Verified) Andrea Electronics
 

Attached Files


  • 0

#39
RKinner

RKinner

    Malware Expert

  • Expert
  • 24,622 posts
  • MVP

I think you should update Norton but you can try using Process Explorer to pause nis.exe.  (Hit the Space bar to make it stop bouncing around.  Then right click on nis.exe and select Pause.  It will tell  you if it can't pause it)  Then rerun Latency Monitor and HD Tune.


Speccy says you have Realtek PCIe GBE Family Controller.  Realtek has had a lot of problems with their drivers.  There was a new one issued in July. 


https://realtek-down...ily-controller/


Choose the first one:

Realtek PCIe GBE Family Controller LAN Driver 7119_06202018 for Windows 7 (10 MB)


The download will start right away.  It is a zip file so you will need to save then right click on it, Extract All, Extract.  Open the resulting folder(s) and look for Setup.exe.  Right click on it and Run As Admin.


  • 0

#40
louuu

louuu

    Member

  • Topic Starter
  • Member
  • PipPipPip
  • 260 posts

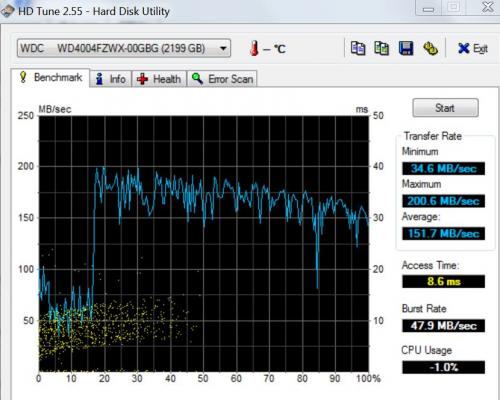
when i went to see if pause was available for nis using process explorer, i didnt see "pause" but i did see "suspend" and im not sure if thats the same so i did suspend it before i continued with your steps.  i still havent upgraded my norton but when/if you tell me to do it i will.  here is the info you requested and i also posted a pic of the latest hd tunes in case you want to see it.  by the way, when i ran these tests before i closed out all my apps first but this time i forgot to close my windows live mail app and im not sure if you want me to run these tests again with it closed.  i also updated the realtek driver, thanks.


_________________________________________________________________________________________________________
CONCLUSION
_________________________________________________________________________________________________________
Your system appears to be suitable for handling real-time audio and other tasks without dropouts. 
LatencyMon has been analyzing your system for  0:03:52  (h:mm:ss) on all processors.
 
 
_________________________________________________________________________________________________________
SYSTEM INFORMATION
_________________________________________________________________________________________________________
Computer name:                                        LUIS8500
OS version:                                           Windows 7 Service Pack 1, 6.1, build: 7601 (x64)
Hardware:                                             XPS 8500  , Dell Inc., 0YJPT1
CPU:                                                  GenuineIntel Intel® Core™ i7-3770 CPU @ 3.40GHz
Logical processors:                                   8
Processor groups:                                     1
RAM:                                                  16344 MB total
 
 
_________________________________________________________________________________________________________
CPU SPEED
_________________________________________________________________________________________________________
Reported CPU speed:                                   3395 MHz
 
Note: reported execution times may be calculated based on a fixed reported CPU speed. Disable variable speed settings like Intel Speed Step and AMD Cool N Quiet in the BIOS setup for more accurate results.
 
WARNING: the CPU speed that was measured is only a fraction of the CPU speed reported. Your CPUs may be throttled back due to variable speed settings and thermal issues. It is suggested that you run a utility which reports your actual CPU frequency and temperature. 


_________________________________________________________________________________________________________
MEASURED INTERRUPT TO USER PROCESS LATENCIES
_________________________________________________________________________________________________________
The interrupt to process latency reflects the measured interval that a usermode process needed to respond to a hardware request from the moment the interrupt service routine started execution. This includes the scheduling and execution of a DPC routine, the signaling of an event and the waking up of a usermode thread from an idle wait state in response to that event.
 
Highest measured interrupt to process latency (µs):   335.634931
Average measured interrupt to process latency (µs):   5.497772
 
Highest measured interrupt to DPC latency (µs):       237.025207
Average measured interrupt to DPC latency (µs):       1.372250
 
 
_________________________________________________________________________________________________________
 REPORTED ISRs
_________________________________________________________________________________________________________
Interrupt service routines are routines installed by the OS and device drivers that execute in response to a hardware interrupt signal.
 
Highest ISR routine execution time (µs):              105.068041
Driver with highest ISR routine execution time:       HDAudBus.sys - High Definition Audio Bus Driver, Microsoft Corporation
 
Highest reported total ISR routine time (%):          0.011887
Driver with highest ISR total time:                   dxgkrnl.sys - DirectX Graphics Kernel, Microsoft Corporation
 
Total time spent in ISRs (%)                          0.019902
 
ISR count (execution time <250 µs):                   53464
ISR count (execution time 250-500 µs):                0
ISR count (execution time 500-999 µs):                0
ISR count (execution time 1000-1999 µs):              0
ISR count (execution time 2000-3999 µs):              0
ISR count (execution time >=4000 µs):                 0
 
 
_________________________________________________________________________________________________________
REPORTED DPCs
_________________________________________________________________________________________________________
DPC routines are part of the interrupt servicing dispatch mechanism and disable the possibility for a process to utilize the CPU while it is interrupted until the DPC has finished execution.
 
Highest DPC routine execution time (µs):              244.18380
Driver with highest DPC routine execution time:       ndis.sys - NDIS 6.20 driver, Microsoft Corporation
 
Highest reported total DPC routine time (%):          0.151820
Driver with highest DPC total execution time:         rspLLL64.sys - Resplendence Latency Monitoring and Auxiliary Kernel Library, Resplendence Software Projects Sp.
 
Total time spent in DPCs (%)                          0.200637
 
DPC count (execution time <250 µs):                   815555
DPC count (execution time 250-500 µs):                0
DPC count (execution time 500-999 µs):                0
DPC count (execution time 1000-1999 µs):              0
DPC count (execution time 2000-3999 µs):              0
DPC count (execution time >=4000 µs):                 0
 
 
_________________________________________________________________________________________________________
 REPORTED HARD PAGEFAULTS
_________________________________________________________________________________________________________
Hard pagefaults are events that get triggered by making use of virtual memory that is not resident in RAM but backed by a memory mapped file on disk. The process of resolving the hard pagefault requires reading in the memory from disk while the process is interrupted and blocked from execution.
 
NOTE: some processes were hit by hard pagefaults. If these were programs producing audio, they are likely to interrupt the audio stream resulting in dropouts, clicks and pops. Check the Processes tab to see which programs were hit.
 
Process with highest pagefault count:                 wlmail.exe
 
Total number of hard pagefaults                       56
Hard pagefault count of hardest hit process:          22
Number of processes hit:                              6
 
 
_________________________________________________________________________________________________________
 PER CPU DATA
_________________________________________________________________________________________________________
CPU 0 Interrupt cycle time (s):                       1.436983
CPU 0 ISR highest execution time (µs):                105.068041
CPU 0 ISR total execution time (s):                   0.050712
CPU 0 ISR count:                                      9797
CPU 0 DPC highest execution time (µs):                172.284536
CPU 0 DPC total execution time (s):                   0.210666
CPU 0 DPC count:                                      51486
_________________________________________________________________________________________________________
CPU 1 Interrupt cycle time (s):                       2.354340
CPU 1 ISR highest execution time (µs):                91.108984
CPU 1 ISR total execution time (s):                   0.039565
CPU 1 ISR count:                                      5194
CPU 1 DPC highest execution time (µs):                140.416495
CPU 1 DPC total execution time (s):                   0.759569
CPU 1 DPC count:                                      152748
_________________________________________________________________________________________________________
CPU 2 Interrupt cycle time (s):                       0.932444
CPU 2 ISR highest execution time (µs):                58.590574
CPU 2 ISR total execution time (s):                   0.006779
CPU 2 ISR count:                                      939
CPU 2 DPC highest execution time (µs):                142.301620
CPU 2 DPC total execution time (s):                   0.107125
CPU 2 DPC count:                                      33734
_________________________________________________________________________________________________________
CPU 3 Interrupt cycle time (s):                       2.635584
CPU 3 ISR highest execution time (µs):                100.374669
CPU 3 ISR total execution time (s):                   0.027971
CPU 3 ISR count:                                      3538
CPU 3 DPC highest execution time (µs):                166.252135
CPU 3 DPC total execution time (s):                   0.301223
CPU 3 DPC count:                                      56177
_________________________________________________________________________________________________________
CPU 4 Interrupt cycle time (s):                       2.680681
CPU 4 ISR highest execution time (µs):                54.207069
CPU 4 ISR total execution time (s):                   0.066140
CPU 4 ISR count:                                      9594
CPU 4 DPC highest execution time (µs):                244.18380
CPU 4 DPC total execution time (s):                   0.582466
CPU 4 DPC count:                                      156266
_________________________________________________________________________________________________________
CPU 5 Interrupt cycle time (s):                       4.079681
CPU 5 ISR highest execution time (µs):                64.852725
CPU 5 ISR total execution time (s):                   0.130001
CPU 5 ISR count:                                      17592
CPU 5 DPC highest execution time (µs):                150.092784
CPU 5 DPC total execution time (s):                   1.254833
CPU 5 DPC count:                                      235421
_________________________________________________________________________________________________________
CPU 6 Interrupt cycle time (s):                       1.524198
CPU 6 ISR highest execution time (µs):                69.641826
CPU 6 ISR total execution time (s):                   0.023870
CPU 6 ISR count:                                      3444
CPU 6 DPC highest execution time (µs):                115.625037
CPU 6 DPC total execution time (s):                   0.301638
CPU 6 DPC count:                                      91051
_________________________________________________________________________________________________________
CPU 7 Interrupt cycle time (s):                       1.888692
CPU 7 ISR highest execution time (µs):                66.417673
CPU 7 ISR total execution time (s):                   0.024729
CPU 7 ISR count:                                      3366
CPU 7 DPC highest execution time (µs):                114.189691
CPU 7 DPC total execution time (s):                   0.210129
CPU 7 DPC count:                                      38672
_________________________________________________________________________________________________________

Attached Thumbnails

  • hd tune 4.JPG

Edited by louuu, 19 November 2018 - 11:46 PM.

  • 0

Advertisements


#41
RKinner

RKinner

    Malware Expert

  • Expert
  • 24,622 posts
  • MVP

WLMail.exe can also be suspended.  It says there are 6 processes causing page faults.  Look on the Driver page of Latency monitor and it should tell you what the others are.


  • 0

#42
louuu

louuu

    Member

  • Topic Starter
  • Member
  • PipPipPip
  • 260 posts
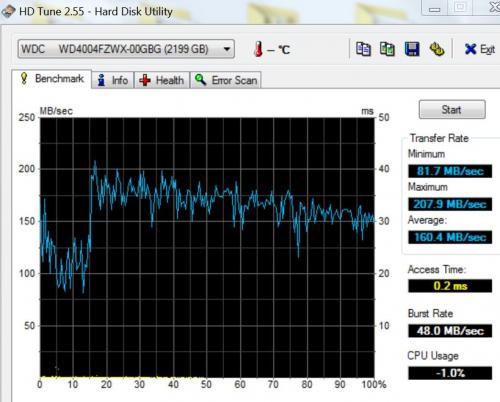
so i re-ran everything including suspending nis.  instead of suspending windows live mail i simply closed the program before i re-ran the reports.  heres the info and hd tunes screenshot.  on the bright side i havent had any bsod's or freeze ups for the last 1.5 or 2 days.  thanks.
 
 
_________________________________________________________________________________________________________
CONCLUSION
_________________________________________________________________________________________________________
Your system appears to be suitable for handling real-time audio and other tasks without dropouts. 
LatencyMon has been analyzing your system for  0:03:50  (h:mm:ss) on all processors.
 
 
_________________________________________________________________________________________________________
SYSTEM INFORMATION
_________________________________________________________________________________________________________
Computer name:                                        LUIS8500
OS version:                                           Windows 7 Service Pack 1, 6.1, build: 7601 (x64)
Hardware:                                             XPS 8500  , Dell Inc., 0YJPT1
CPU:                                                  GenuineIntel Intel® Core™ i7-3770 CPU @ 3.40GHz
Logical processors:                                   8
Processor groups:                                     1
RAM:                                                  16344 MB total
 
 
_________________________________________________________________________________________________________
CPU SPEED
_________________________________________________________________________________________________________
Reported CPU speed:                                   3395 MHz
 
Note: reported execution times may be calculated based on a fixed reported CPU speed. Disable variable speed settings like Intel Speed Step and AMD Cool N Quiet in the BIOS setup for more accurate results.
 
WARNING: the CPU speed that was measured is only a fraction of the CPU speed reported. Your CPUs may be throttled back due to variable speed settings and thermal issues. It is suggested that you run a utility which reports your actual CPU frequency and temperature. 


_________________________________________________________________________________________________________
MEASURED INTERRUPT TO USER PROCESS LATENCIES
_________________________________________________________________________________________________________
The interrupt to process latency reflects the measured interval that a usermode process needed to respond to a hardware request from the moment the interrupt service routine started execution. This includes the scheduling and execution of a DPC routine, the signaling of an event and the waking up of a usermode thread from an idle wait state in response to that event.
 
Highest measured interrupt to process latency (µs):   264.768615
Average measured interrupt to process latency (µs):   5.682515
 
Highest measured interrupt to DPC latency (µs):       249.992235
Average measured interrupt to DPC latency (µs):       1.471083
 
 
_________________________________________________________________________________________________________
 REPORTED ISRs
_________________________________________________________________________________________________________
Interrupt service routines are routines installed by the OS and device drivers that execute in response to a hardware interrupt signal.
 
Highest ISR routine execution time (µs):              92.696318
Driver with highest ISR routine execution time:       HDAudBus.sys - High Definition Audio Bus Driver, Microsoft Corporation
 
Highest reported total ISR routine time (%):          0.011638
Driver with highest ISR total time:                   dxgkrnl.sys - DirectX Graphics Kernel, Microsoft Corporation
 
Total time spent in ISRs (%)                          0.019728
 
ISR count (execution time <250 µs):                   52671
ISR count (execution time 250-500 µs):                0
ISR count (execution time 500-999 µs):                0
ISR count (execution time 1000-1999 µs):              0
ISR count (execution time 2000-3999 µs):              0
ISR count (execution time >=4000 µs):                 0
 
 
_________________________________________________________________________________________________________
REPORTED DPCs
_________________________________________________________________________________________________________
DPC routines are part of the interrupt servicing dispatch mechanism and disable the possibility for a process to utilize the CPU while it is interrupted until the DPC has finished execution.
 
Highest DPC routine execution time (µs):              176.169367
Driver with highest DPC routine execution time:       ntoskrnl.exe - NT Kernel & System, Microsoft Corporation
 
Highest reported total DPC routine time (%):          0.135358
Driver with highest DPC total execution time:         ndis.sys - NDIS 6.20 driver, Microsoft Corporation
 
Total time spent in DPCs (%)                          0.189870
 
DPC count (execution time <250 µs):                   758984
DPC count (execution time 250-500 µs):                0
DPC count (execution time 500-999 µs):                0
DPC count (execution time 1000-1999 µs):              0
DPC count (execution time 2000-3999 µs):              0
DPC count (execution time >=4000 µs):                 0
 
 
_________________________________________________________________________________________________________
 REPORTED HARD PAGEFAULTS
_________________________________________________________________________________________________________
Hard pagefaults are events that get triggered by making use of virtual memory that is not resident in RAM but backed by a memory mapped file on disk. The process of resolving the hard pagefault requires reading in the memory from disk while the process is interrupted and blocked from execution.
 
 
Process with highest pagefault count:                 none
 
Total number of hard pagefaults                       0
Hard pagefault count of hardest hit process:          0
Number of processes hit:                              0
 
 
_________________________________________________________________________________________________________
 PER CPU DATA
_________________________________________________________________________________________________________
CPU 0 Interrupt cycle time (s):                       1.289999
CPU 0 ISR highest execution time (µs):                92.696318
CPU 0 ISR total execution time (s):                   0.083255
CPU 0 ISR count:                                      14342
CPU 0 DPC highest execution time (µs):                176.169367
CPU 0 DPC total execution time (s):                   0.262605
CPU 0 DPC count:                                      60229
_________________________________________________________________________________________________________
CPU 1 Interrupt cycle time (s):                       2.101115
CPU 1 ISR highest execution time (µs):                78.903682
CPU 1 ISR total execution time (s):                   0.028208
CPU 1 ISR count:                                      3816
CPU 1 DPC highest execution time (µs):                114.326657
CPU 1 DPC total execution time (s):                   0.44860
CPU 1 DPC count:                                      86982
_________________________________________________________________________________________________________
CPU 2 Interrupt cycle time (s):                       0.908480
CPU 2 ISR highest execution time (µs):                58.620913
CPU 2 ISR total execution time (s):                   0.006397
CPU 2 ISR count:                                      816
CPU 2 DPC highest execution time (µs):                109.089543
CPU 2 DPC total execution time (s):                   0.094323
CPU 2 DPC count:                                      29452
_________________________________________________________________________________________________________
CPU 3 Interrupt cycle time (s):                       2.405468
CPU 3 ISR highest execution time (µs):                72.134904
CPU 3 ISR total execution time (s):                   0.030917
CPU 3 ISR count:                                      4083
CPU 3 DPC highest execution time (µs):                148.057437
CPU 3 DPC total execution time (s):                   0.380182
CPU 3 DPC count:                                      71659
_________________________________________________________________________________________________________
CPU 4 Interrupt cycle time (s):                       2.729005
CPU 4 ISR highest execution time (µs):                70.017084
CPU 4 ISR total execution time (s):                   0.051388
CPU 4 ISR count:                                      7219
CPU 4 DPC highest execution time (µs):                114.865979
CPU 4 DPC total execution time (s):                   0.558490
CPU 4 DPC count:                                      147212
_________________________________________________________________________________________________________
CPU 5 Interrupt cycle time (s):                       3.762794
CPU 5 ISR highest execution time (µs):                71.302504
CPU 5 ISR total execution time (s):                   0.095145
CPU 5 ISR count:                                      12728
CPU 5 DPC highest execution time (µs):                106.621208
CPU 5 DPC total execution time (s):                   0.958898
CPU 5 DPC count:                                      176632
_________________________________________________________________________________________________________
CPU 6 Interrupt cycle time (s):                       1.887998
CPU 6 ISR highest execution time (µs):                80.958174
CPU 6 ISR total execution time (s):                   0.032082
CPU 6 ISR count:                                      4590
CPU 6 DPC highest execution time (µs):                102.311046
CPU 6 DPC total execution time (s):                   0.401975
CPU 6 DPC count:                                      113202
_________________________________________________________________________________________________________
CPU 7 Interrupt cycle time (s):                       2.555180
CPU 7 ISR highest execution time (µs):                71.121944
CPU 7 ISR total execution time (s):                   0.036568
CPU 7 ISR count:                                      5077
CPU 7 DPC highest execution time (µs):                133.490133
CPU 7 DPC total execution time (s):                   0.397886
CPU 7 DPC count:                                      73616
_________________________________________________________________________________________________________

Attached Thumbnails

  • hd tune 5.JPG

Edited by louuu, 20 November 2018 - 06:22 AM.

  • 0

#43
RKinner

RKinner

    Malware Expert

  • Expert
  • 24,622 posts
  • MVP

Doesn't look very good.  Try Data Lifeguard Diagnostic for Windows

https://support.wdc....ds.aspx?lang=en


See what their extended or long test will tell you.


  • 0

#44
louuu

louuu

    Member

  • Topic Starter
  • Member
  • PipPipPip
  • 260 posts

ok, ill download data lifeguard diagnostic for windows and post the results shortly but im curious, when you say it doesnt look very good what exactly are you talking about?  my hard drive?  my entire system?  thanks.


  • 0

#45
RKinner

RKinner

    Malware Expert

  • Expert
  • 24,622 posts
  • MVP

The hard drive appears weak.  Not sure why it has that dip at the beginning.


  • 0


Similar Topics

0 user(s) are reading this topic

0 members, 0 guests, 0 anonymous users

As Featured On:

Microsoft Yahoo BBC MSN PC Magazine Washington Post HP