
Fix result of Farbar Recovery Scan Tool (x64) Version: 14-11-2022
Ran by Kimberly (14-11-2022 10:39:29) Run:3
Running from C:\Users\Kimberly\Downloads
Loaded Profiles: Kimberly
Boot Mode: Normal
==============================================
fixlist content:
*****************
CMD: sc stop NetBT
CMD: sc config NetBT start= disabled
*****************
========= sc stop NetBT =========
SERVICE_NAME: NetBT
TYPE : 1 KERNEL_DRIVER
STATE : 3 STOP_PENDING
(STOPPABLE, NOT_PAUSABLE, IGNORES_SHUTDOWN)
WIN32_EXIT_CODE : 0 (0x0)
SERVICE_EXIT_CODE : 0 (0x0)
CHECKPOINT : 0x0
WAIT_HINT : 0x0
========= End of CMD: =========
========= sc config NetBT start= disabled =========
[SC] ChangeServiceConfig SUCCESS
========= End of CMD: =========
==== End of Fixlog 10:39:31 ====

Old Dell Suddenly Slowing Down
#61

 Posted 14 November 2022 - 09:40 AM
- Topic Starter
-
- Member
-

- 146 posts
Member

#62
Posted 14 November 2022 - 09:49 AM
- Topic Starter
-
- Member
-
- 146 posts
Member
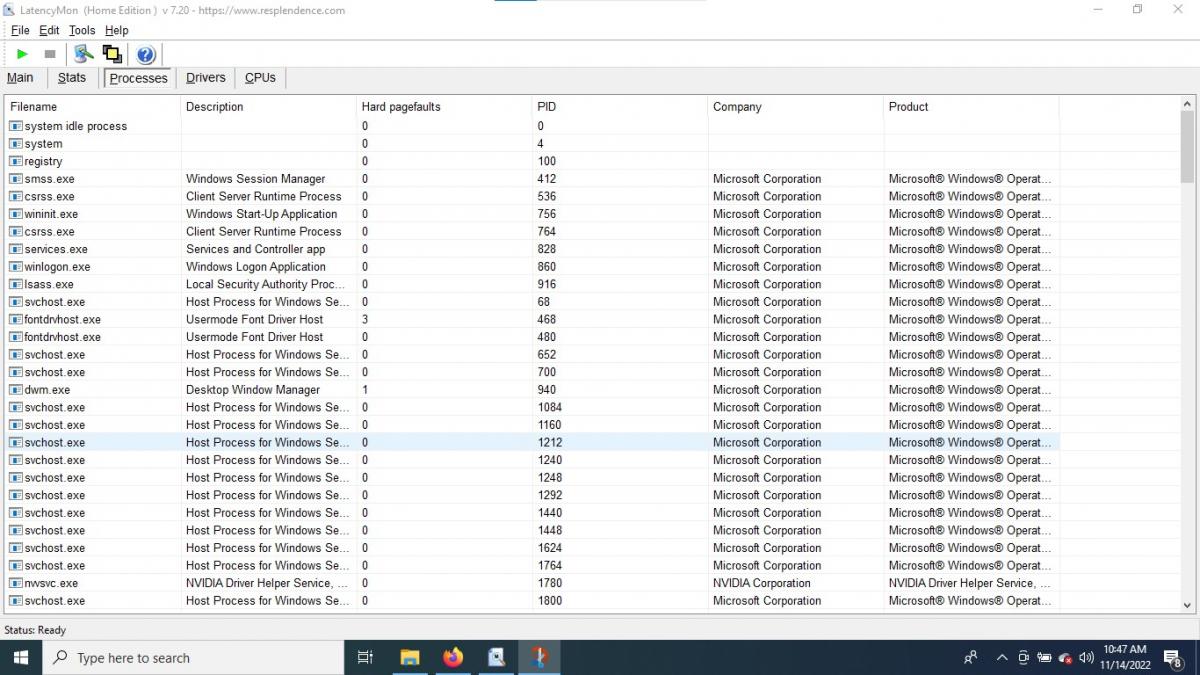
New Latency Mon...
Attached Thumbnails
#63
Posted 14 November 2022 - 11:36 AM
-

- Expert
-

- 24,731 posts
Malware Expert
I need the Summary report and if there are any page faults please sort them to the top by clicking on the Hard Pagefaults column header on the processes page.
#64
Posted 14 November 2022 - 12:41 PM
- Topic Starter
-
- Member
-
- 146 posts
Member
_________________________________________________________________________________________________________
CONCLUSION
_________________________________________________________________________________________________________
Your system appears to be suitable for handling real-time audio and other tasks without dropouts.
LatencyMon has been analyzing your system for 0:00:26 (h:mm:ss) on all processors.
_________________________________________________________________________________________________________
SYSTEM INFORMATION
_________________________________________________________________________________________________________
Computer name: KIMBERLY-PC
OS version: Windows 10, 10.0, version 2009, build: 19044 (x64)
Hardware: Dell System XPS L502X, Dell Inc.
BIOS: Default System BIOS
CPU: GenuineIntel Intel® Core™ i5-2410M CPU @ 2.30GHz
Logical processors: 4
Processor groups: 1
Processor group size: 4
RAM: 3990 MB total
_________________________________________________________________________________________________________
CPU SPEED
_________________________________________________________________________________________________________
Reported CPU speed (WMI): 140 MHz
Reported CPU speed (registry): 2295 MHz
Note: reported execution times may be calculated based on a fixed reported CPU speed. Disable variable speed settings like Intel Speed Step and AMD Cool N Quiet in the BIOS setup for more accurate results.
_________________________________________________________________________________________________________
MEASURED INTERRUPT TO USER PROCESS LATENCIES
_________________________________________________________________________________________________________
The interrupt to process latency reflects the measured interval that a usermode process needed to respond to a hardware request from the moment the interrupt service routine started execution. This includes the scheduling and execution of a DPC routine, the signaling of an event and the waking up of a usermode thread from an idle wait state in response to that event.
Highest measured interrupt to process latency (µs): 193.10
Average measured interrupt to process latency (µs): 17.171744
Highest measured interrupt to DPC latency (µs): 156.0
Average measured interrupt to DPC latency (µs): 3.821238
_________________________________________________________________________________________________________
REPORTED ISRs
_________________________________________________________________________________________________________
Interrupt service routines are routines installed by the OS and device drivers that execute in response to a hardware interrupt signal.
Highest ISR routine execution time (µs): 18.800871
Driver with highest ISR routine execution time: Wdf01000.sys - Kernel Mode Driver Framework Runtime, Microsoft Corporation
Highest reported total ISR routine time (%): 0.001180
Driver with highest ISR total time: Wdf01000.sys - Kernel Mode Driver Framework Runtime, Microsoft Corporation
Total time spent in ISRs (%) 0.001208
ISR count (execution time <250 µs): 238
ISR count (execution time 250-500 µs): 0
ISR count (execution time 500-1000 µs): 0
ISR count (execution time 1000-2000 µs): 0
ISR count (execution time 2000-4000 µs): 0
ISR count (execution time >=4000 µs): 0
_________________________________________________________________________________________________________
REPORTED DPCs
_________________________________________________________________________________________________________
DPC routines are part of the interrupt servicing dispatch mechanism and disable the possibility for a process to utilize the CPU while it is interrupted until the DPC has finished execution.
Highest DPC routine execution time (µs): 158.935512
Driver with highest DPC routine execution time: ndis.sys - Network Driver Interface Specification (NDIS), Microsoft Corporation
Highest reported total DPC routine time (%): 0.105878
Driver with highest DPC total execution time: storport.sys - Microsoft Storage Port Driver, Microsoft Corporation
Total time spent in DPCs (%) 0.224807
DPC count (execution time <250 µs): 20431
DPC count (execution time 250-500 µs): 0
DPC count (execution time 500-10000 µs): 0
DPC count (execution time 1000-2000 µs): 0
DPC count (execution time 2000-4000 µs): 0
DPC count (execution time >=4000 µs): 0
_________________________________________________________________________________________________________
REPORTED HARD PAGEFAULTS
_________________________________________________________________________________________________________
Hard pagefaults are events that get triggered by making use of virtual memory that is not resident in RAM but backed by a memory mapped file on disk. The process of resolving the hard pagefault requires reading in the memory from disk while the process is interrupted and blocked from execution.
NOTE: some processes were hit by hard pagefaults. If these were programs producing audio, they are likely to interrupt the audio stream resulting in dropouts, clicks and pops. Check the Processes tab to see which programs were hit.
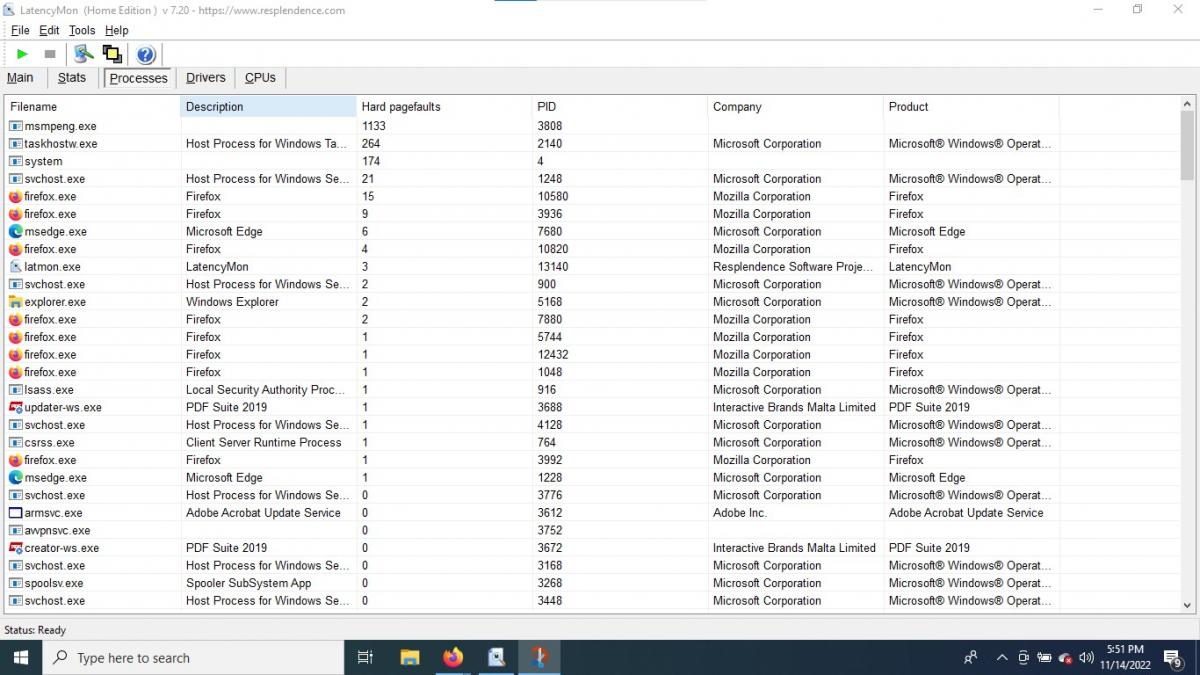
Process with highest pagefault count: msmpeng.exe
Total number of hard pagefaults 1863
Hard pagefault count of hardest hit process: 1133
Number of processes hit: 21
_________________________________________________________________________________________________________
PER CPU DATA
_________________________________________________________________________________________________________
CPU 0 Interrupt cycle time (s): 0.538079
CPU 0 ISR highest execution time (µs): 18.800871
CPU 0 ISR total execution time (s): 0.001263
CPU 0 ISR count: 238
CPU 0 DPC highest execution time (µs): 137.258388
CPU 0 DPC total execution time (s): 0.151473
CPU 0 DPC count: 15945
_________________________________________________________________________________________________________
CPU 1 Interrupt cycle time (s): 0.170875
CPU 1 ISR highest execution time (µs): 0.0
CPU 1 ISR total execution time (s): 0.0
CPU 1 ISR count: 0
CPU 1 DPC highest execution time (µs): 100.79390
CPU 1 DPC total execution time (s): 0.014382
CPU 1 DPC count: 746
_________________________________________________________________________________________________________
CPU 2 Interrupt cycle time (s): 0.262418
CPU 2 ISR highest execution time (µs): 0.0
CPU 2 ISR total execution time (s): 0.0
CPU 2 ISR count: 0
CPU 2 DPC highest execution time (µs): 158.935512
CPU 2 DPC total execution time (s): 0.047193
CPU 2 DPC count: 2772
_________________________________________________________________________________________________________
CPU 3 Interrupt cycle time (s): 0.196609
CPU 3 ISR highest execution time (µs): 0.0
CPU 3 ISR total execution time (s): 0.0
CPU 3 ISR count: 0
CPU 3 DPC highest execution time (µs): 104.717647
CPU 3 DPC total execution time (s): 0.022020
CPU 3 DPC count: 968
_________________________________________________________________________________________________________
Attached Thumbnails
#65
Posted 14 November 2022 - 02:51 PM
-
- Expert
-
- 24,731 posts
Malware Expert
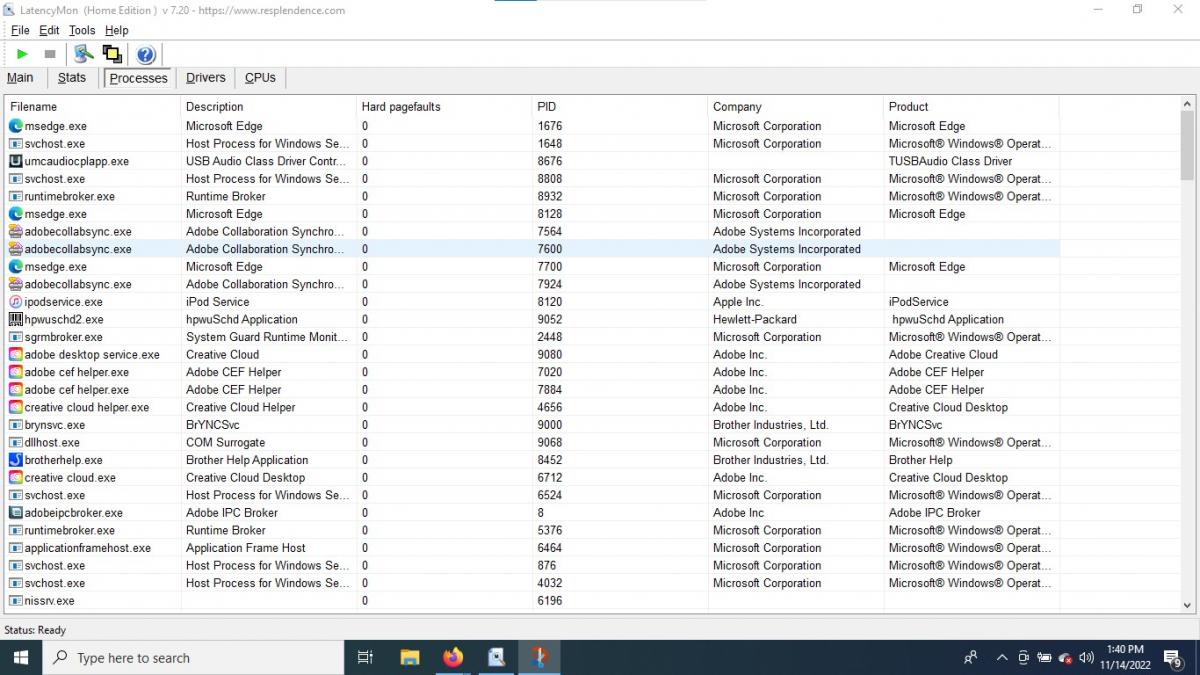
I can see from the summary that we have finally killed off netbt but the Processes page doesn't show any of the 1863 pagefaults. Perhaps they are sorted to the bottom. Can you try again and click on the Hard Pagefaults column header once or twice until the pagefaults items are at the top. The worst offender seems to be Windows Defender so we may need to try installing Avast.
#66
Posted 14 November 2022 - 04:54 PM
- Topic Starter
-
- Member
-
- 146 posts
Member
New Latency Mon...
Also, it won't allow me to use the Search Bar on the taskbar now.....
Attached Thumbnails
#67
Posted 14 November 2022 - 07:28 PM
-
- Expert
-
- 24,731 posts
Malware Expert
Search was crashing in the last FRST scan. Try running the Search and Indexing Troubleshooter.
Settings, Update & Security, Troubleshoot, Additional Troubleshooters, Search & Indexing.
Also I think we need to try Avast to shutdown Windows Defender.
#68
Posted 14 November 2022 - 08:25 PM
- Topic Starter
-
- Member
-
- 146 posts
Member
Latency Mon...
Attached Thumbnails

Edited by monkeyboyblues, 14 November 2022 - 08:27 PM.
#69
Posted 14 November 2022 - 08:26 PM
- Topic Starter
-
- Member
-
- 146 posts
Member
_________________________________________________________________________________________________________
CONCLUSION
_________________________________________________________________________________________________________
Your system appears to be suitable for handling real-time audio and other tasks without dropouts.
LatencyMon has been analyzing your system for 0:00:23 (h:mm:ss) on all processors.
_________________________________________________________________________________________________________
SYSTEM INFORMATION
_________________________________________________________________________________________________________
Computer name: KIMBERLY-PC
OS version: Windows 10, 10.0, version 2009, build: 19044 (x64)
Hardware: Dell System XPS L502X, Dell Inc.
BIOS: Default System BIOS
CPU: GenuineIntel Intel® Core™ i5-2410M CPU @ 2.30GHz
Logical processors: 4
Processor groups: 1
Processor group size: 4
RAM: 3990 MB total
_________________________________________________________________________________________________________
CPU SPEED
_________________________________________________________________________________________________________
Reported CPU speed (WMI): 140 MHz
Reported CPU speed (registry): 2295 MHz
Note: reported execution times may be calculated based on a fixed reported CPU speed. Disable variable speed settings like Intel Speed Step and AMD Cool N Quiet in the BIOS setup for more accurate results.
_________________________________________________________________________________________________________
MEASURED INTERRUPT TO USER PROCESS LATENCIES
_________________________________________________________________________________________________________
The interrupt to process latency reflects the measured interval that a usermode process needed to respond to a hardware request from the moment the interrupt service routine started execution. This includes the scheduling and execution of a DPC routine, the signaling of an event and the waking up of a usermode thread from an idle wait state in response to that event.
Highest measured interrupt to process latency (µs): 286.10
Average measured interrupt to process latency (µs): 21.789649
Highest measured interrupt to DPC latency (µs): 264.80
Average measured interrupt to DPC latency (µs): 5.808734
_________________________________________________________________________________________________________
REPORTED ISRs
_________________________________________________________________________________________________________
Interrupt service routines are routines installed by the OS and device drivers that execute in response to a hardware interrupt signal.
Highest ISR routine execution time (µs): 9.440523
Driver with highest ISR routine execution time: Wdf01000.sys - Kernel Mode Driver Framework Runtime, Microsoft Corporation
Highest reported total ISR routine time (%): 0.000629
Driver with highest ISR total time: Wdf01000.sys - Kernel Mode Driver Framework Runtime, Microsoft Corporation
Total time spent in ISRs (%) 0.000629
ISR count (execution time <250 µs): 106
ISR count (execution time 250-500 µs): 0
ISR count (execution time 500-1000 µs): 0
ISR count (execution time 1000-2000 µs): 0
ISR count (execution time 2000-4000 µs): 0
ISR count (execution time >=4000 µs): 0
_________________________________________________________________________________________________________
REPORTED DPCs
_________________________________________________________________________________________________________
DPC routines are part of the interrupt servicing dispatch mechanism and disable the possibility for a process to utilize the CPU while it is interrupted until the DPC has finished execution.
Highest DPC routine execution time (µs): 340.289760
Driver with highest DPC routine execution time: ndis.sys - Network Driver Interface Specification (NDIS), Microsoft Corporation
Highest reported total DPC routine time (%): 0.087085
Driver with highest DPC total execution time: storport.sys - Microsoft Storage Port Driver, Microsoft Corporation
Total time spent in DPCs (%) 0.170853
DPC count (execution time <250 µs): 7986
DPC count (execution time 250-500 µs): 0
DPC count (execution time 500-10000 µs): 1
DPC count (execution time 1000-2000 µs): 0
DPC count (execution time 2000-4000 µs): 0
DPC count (execution time >=4000 µs): 0
_________________________________________________________________________________________________________
REPORTED HARD PAGEFAULTS
_________________________________________________________________________________________________________
Hard pagefaults are events that get triggered by making use of virtual memory that is not resident in RAM but backed by a memory mapped file on disk. The process of resolving the hard pagefault requires reading in the memory from disk while the process is interrupted and blocked from execution.
NOTE: some processes were hit by hard pagefaults. If these were programs producing audio, they are likely to interrupt the audio stream resulting in dropouts, clicks and pops. Check the Processes tab to see which programs were hit.
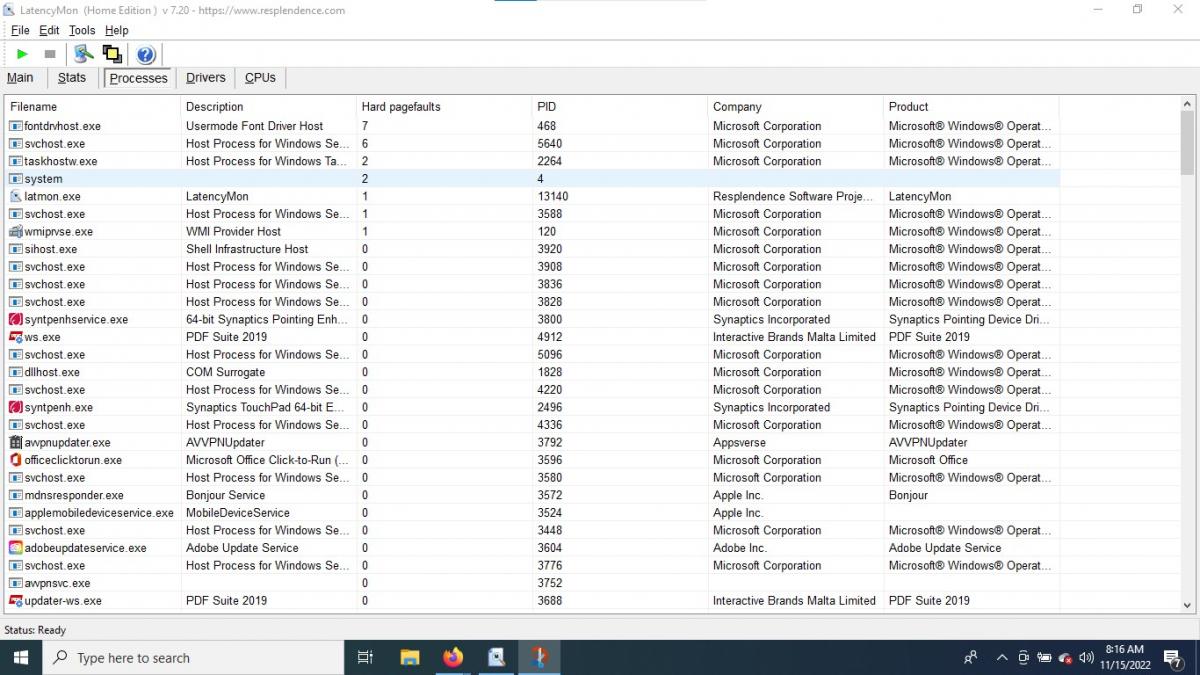
Process with highest pagefault count: avastsvc.exe
Total number of hard pagefaults 1244
Hard pagefault count of hardest hit process: 664
Number of processes hit: 22
_________________________________________________________________________________________________________
PER CPU DATA
_________________________________________________________________________________________________________
CPU 0 Interrupt cycle time (s): 0.358515
CPU 0 ISR highest execution time (µs): 9.440523
CPU 0 ISR total execution time (s): 0.000579
CPU 0 ISR count: 106
CPU 0 DPC highest execution time (µs): 340.289760
CPU 0 DPC total execution time (s): 0.096944
CPU 0 DPC count: 5287
_________________________________________________________________________________________________________
CPU 1 Interrupt cycle time (s): 0.051917
CPU 1 ISR highest execution time (µs): 0.0
CPU 1 ISR total execution time (s): 0.0
CPU 1 ISR count: 0
CPU 1 DPC highest execution time (µs): 121.262309
CPU 1 DPC total execution time (s): 0.006099
CPU 1 DPC count: 326
_________________________________________________________________________________________________________
CPU 2 Interrupt cycle time (s): 0.116960
CPU 2 ISR highest execution time (µs): 0.0
CPU 2 ISR total execution time (s): 0.0
CPU 2 ISR count: 0
CPU 2 DPC highest execution time (µs): 170.616122
CPU 2 DPC total execution time (s): 0.035697
CPU 2 DPC count: 1484
_________________________________________________________________________________________________________
CPU 3 Interrupt cycle time (s): 0.105761
CPU 3 ISR highest execution time (µs): 0.0
CPU 3 ISR total execution time (s): 0.0
CPU 3 ISR count: 0
CPU 3 DPC highest execution time (µs): 93.781264
CPU 3 DPC total execution time (s): 0.018554
CPU 3 DPC count: 890
_________________________________________________________________________________________________________
#70
Posted 15 November 2022 - 05:29 AM
-
- Expert
-
- 24,731 posts
Malware Expert
Processes page is a repeat of the previous one.
#71
Posted 15 November 2022 - 07:18 AM
- Topic Starter
-
- Member
-
- 146 posts
Member
See attachment...
Attached Thumbnails
#72
Posted 15 November 2022 - 02:18 PM
-
- Expert
-
- 24,731 posts
Malware Expert
That looks much better. How is it running now?
#73
Posted 15 November 2022 - 04:58 PM
- Topic Starter
-
- Member
-
- 146 posts
Member
Pretty good.
Slows down sometimes when several tabs are open though.
Thank you for your help!!
Two questions if I may:
1. Are Windows updates really necessary? If not, can I turn them off?
2. Regarding my other old computer... if I can upgrade the RAM and get that graphics driver you sent on there, will that fix the slowness?
#74
Posted 15 November 2022 - 05:13 PM
-
- Expert
-
- 24,731 posts
Malware Expert
Make sure you have the Ublock Origin extension installed on your browser.
Did you get the search to work?
Avast will nag you to upgrade. Right click on the icon and select Silent Mode. That will shut it up.
Adding more RAM is always good. (the current one could use some more too. Speccy says you have 2 x 2GB. You would have to replace one or both of them with 4GB.) The driver might help but it's hard to say.
#75
Posted 15 November 2022 - 05:22 PM
- Topic Starter
-
- Member
-
- 146 posts
Member
Yes the search works now


Similar Topics
0 user(s) are reading this topic
0 members, 0 guests, 0 anonymous users
As Featured On:


 Sign In
 Create Account
