I have a bluescreen viewer !! The crash is caused by NTFS.sys and ntoskrnl.exe !! those are the latest dump files !! And ve actually uploaded it in reply #18 !!
Not according to the crash dump that you uploaded in reply #18
Debug session time: Wed May 13 01:38:36.573 2015 (UTC - 4:00)
System Uptime: 0 days 0:51:01.900
*******************************************************************************
* *
* Bugcheck Analysis *
* *
*******************************************************************************
SYSTEM_THREAD_EXCEPTION_NOT_HANDLED_M (1000007e)
This is a very common bugcheck. Usually the exception address pinpoints
the driver/function that caused the problem. Always note this address
as well as the link date of the driver/image that contains this address.
Some common problems are exception code 0x80000003. This means a hard
coded breakpoint or assertion was hit, but this system was booted
/NODEBUG. This is not supposed to happen as developers should never have
hardcoded breakpoints in retail code, but ...
If this happens, make sure a debugger gets connected, and the
system is booted /DEBUG. This will let us see why this breakpoint is
happening.
Arguments:
Arg1: ffffffffc0000005, The exception code that was not handled
Arg2: fffff88005356bc8, The address that the exception occurred at
Arg3: fffff88002d1ad48, Exception Record Address
Arg4: fffff88002d1a5a0, Context Record Address
Debugging Details:
------------------
TRIAGER: Could not open triage file : e:\dump_analysis\program\triage\modclass.ini, error 2
EXCEPTION_CODE: (NTSTATUS) 0xc0000005 - The instruction at "0x%08lx" referenced memory at "0x%08lx". The memory could not be "%s".
FAULTING_IP:
nvlddmkm+144bc8
fffff880`05356bc8 ff9008010000 call qword ptr [rax+108h]
EXCEPTION_RECORD: fffff88002d1ad48 -- (.exr 0xfffff88002d1ad48)
ExceptionAddress: fffff88005356bc8 (nvlddmkm+0x0000000000144bc8)
ExceptionCode: c0000005 (Access violation)
ExceptionFlags: 00000000
NumberParameters: 2
Parameter[0]: 0000000000000000
Parameter[1]: ffffffffffffffff
Attempt to read from address ffffffffffffffff
CONTEXT: fffff88002d1a5a0 -- (.cxr 0xfffff88002d1a5a0)
rax=fffff88005733b18 rbx=fffffa8005d61000 rcx=fffffa8005c49000
rdx=0000000073420000 rsi=fffffa8005152000 rdi=0000000000000000
rip=fffff88005356bc8 rsp=fffff88002d1af80 rbp=fffff88002d1b0a0
r8=0000000000420000 r9=0000000000000004 r10=0000000000000000
r11=fffff880056fe18f r12=fffffa8005c49000 r13=0000000000000000
r14=fffffa8005d1f010 r15=fffff88002d1b4c0
iopl=0 nv up ei ng nz na pe nc
cs=0010 ss=0018 ds=002b es=002b fs=0053 gs=002b efl=00010282
nvlddmkm+0x144bc8:
fffff880`05356bc8 ff9008010000 call qword ptr [rax+108h] ds:002b:fffff880`05733c20=fffff88005362708
Resetting default scope
DEFAULT_BUCKET_ID: WIN7_DRIVER_FAULT
PROCESS_NAME: System
CURRENT_IRQL: 0
ERROR_CODE: (NTSTATUS) 0xc0000005 - The instruction at "0x%08lx" referenced memory at "0x%08lx". The memory could not be "%s".
EXCEPTION_PARAMETER1: 0000000000000000
EXCEPTION_PARAMETER2: ffffffffffffffff
READ_ADDRESS: GetPointerFromAddress: unable to read from fffff80001eb0100
GetUlongFromAddress: unable to read from fffff80001eb01c0
ffffffffffffffff
FOLLOWUP_IP:
nvlddmkm+144bc8
fffff880`05356bc8 ff9008010000 call qword ptr [rax+108h]
BUGCHECK_STR: 0x7E
LAST_CONTROL_TRANSFER: from fffffa8005c49000 to fffff88005356bc8
STACK_TEXT:
fffff880`02d1af80 fffffa80`05c49000 : fffff880`02d1b0a0 fffffa80`05152000 fffff880`052fcd86 0000000f`ffffc938 : nvlddmkm+0x144bc8
fffff880`02d1af88 fffff880`02d1b0a0 : fffffa80`05152000 fffff880`052fcd86 0000000f`ffffc938 fffffa80`03f83ae8 : 0xfffffa80`05c49000
fffff880`02d1af90 fffffa80`05152000 : fffff880`052fcd86 0000000f`ffffc938 fffffa80`03f83ae8 000000ff`fffff56c : 0xfffff880`02d1b0a0
fffff880`02d1af98 fffff880`052fcd86 : 0000000f`ffffc938 fffffa80`03f83ae8 000000ff`fffff56c fffff880`052fcd86 : 0xfffffa80`05152000
fffff880`02d1afa0 0000000f`ffffc938 : fffffa80`03f83ae8 000000ff`fffff56c fffff880`052fcd86 000000ff`fffff56c : nvlddmkm+0xead86
fffff880`02d1afa8 fffffa80`03f83ae8 : 000000ff`fffff56c fffff880`052fcd86 000000ff`fffff56c fffff880`052fcca6 : 0xf`ffffc938
fffff880`02d1afb0 000000ff`fffff56c : fffff880`052fcd86 000000ff`fffff56c fffff880`052fcca6 0000000f`ffffc938 : 0xfffffa80`03f83ae8
fffff880`02d1afb8 fffff880`052fcd86 : 000000ff`fffff56c fffff880`052fcca6 0000000f`ffffc938 fffff880`052fdb27 : 0xff`fffff56c
fffff880`02d1afc0 000000ff`fffff56c : fffff880`052fcca6 0000000f`ffffc938 fffff880`052fdb27 00000000`00000000 : nvlddmkm+0xead86
fffff880`02d1afc8 fffff880`052fcca6 : 0000000f`ffffc938 fffff880`052fdb27 00000000`00000000 00000000`00000001 : 0xff`fffff56c
fffff880`02d1afd0 0000000f`ffffc938 : fffff880`052fdb27 00000000`00000000 00000000`00000001 fffffa80`03f83ae8 : nvlddmkm+0xeaca6
fffff880`02d1afd8 fffff880`052fdb27 : 00000000`00000000 00000000`00000001 fffffa80`03f83ae8 00000000`00000001 : 0xf`ffffc938
fffff880`02d1afe0 00000000`00000000 : 00000000`00000001 fffffa80`03f83ae8 00000000`00000001 0000000f`fffd4004 : nvlddmkm+0xebb27
SYMBOL_STACK_INDEX: 0
SYMBOL_NAME: nvlddmkm+144bc8
FOLLOWUP_NAME: MachineOwner
MODULE_NAME: nvlddmkm
IMAGE_NAME: nvlddmkm.sys
DEBUG_FLR_IMAGE_TIMESTAMP: 55259065
STACK_COMMAND: .cxr 0xfffff88002d1a5a0 ; kb
FAILURE_BUCKET_ID: X64_0x7E_nvlddmkm+144bc8
BUCKET_ID: X64_0x7E_nvlddmkm+144bc8
Followup: MachineOwner
---------
Also of note from your crash dump was that the driver
kbdhid.sys was failing to load, this may or may not be related but regardless either way it needs to be addressed, we need some further hardware and software information so please see below;
Download then run Speccy (free) and post the resultant url for us, details here, this will provide us with information about your computer hardware + any software that you have installed that may explain the present issue/s.
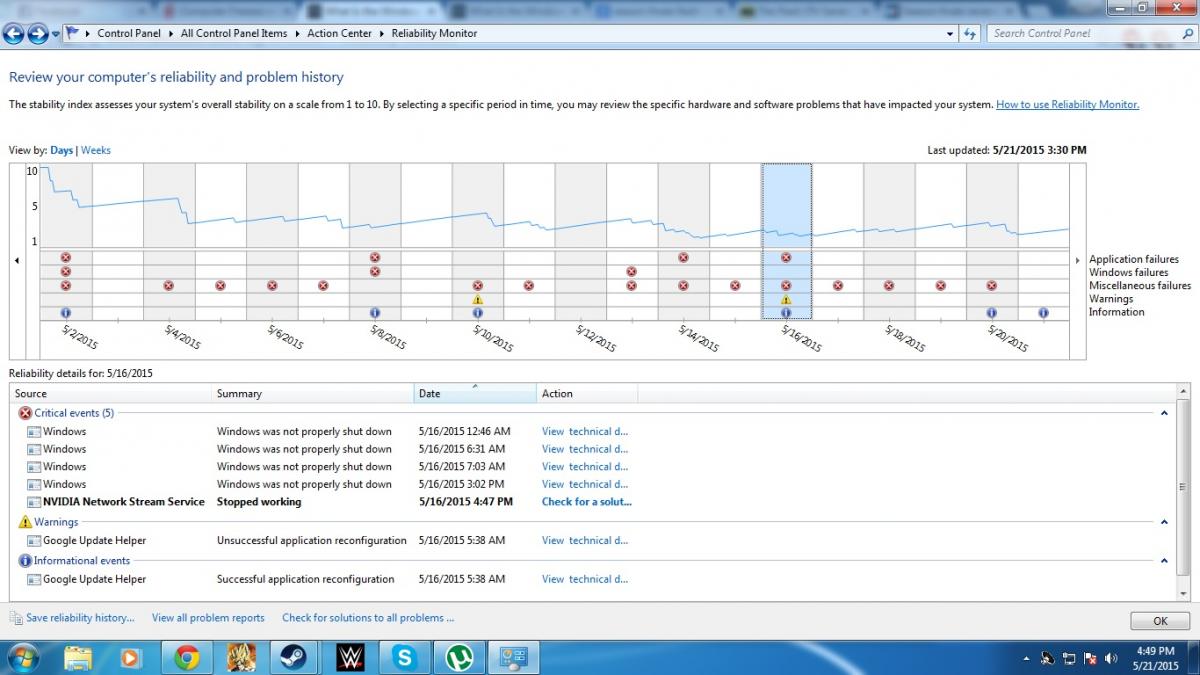
JFYI: Reliability monitor is showing that something else is shutting down Windows prematurely rather than Windows itself crashing, that would explain the absence of any further crash dumps.


 Sign In
 Create Account
