Jump to content

Welcome to Geeks to Go - Register now for FREE

Need help with your computer or device? Want to learn new tech skills? You're in the right place!
Geeks to Go is a friendly community of tech experts who can solve any problem you have. Just create a free account and post your question. Our volunteers will reply quickly and guide you through the steps. Don't let tech troubles stop you. Join Geeks to Go now and get the support you need!

How it Works Create Account
Photo

for rkinner

virus disk slow laptop

  • Please log in to reply

#16
RKinner

RKinner

    Malware Expert

  • Expert
  • 24,598 posts
  • MVP

No.  We are using the resource monitor to tell us what logs in the event viewer to disable.  The resource monitor is just a reference.


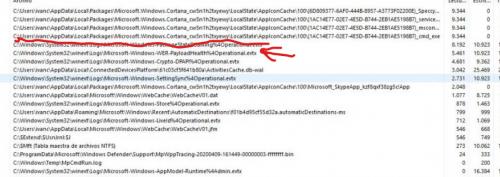
Look at the attached picture. 

log.jpg

We have already done the one I crossed through.  The next one is ...WER-PayloadHealth%4Operational.etvx


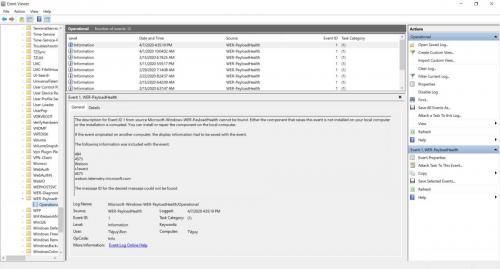
That translates to this log:


Search for

Event Viewer

hit Enter

This will bring up the Event Viewer.

Click the arrow in front of Applications and Services Log

Click the arrow in front of Microsoft

Click the arrow in front of Windows

You will see a long list of possible logs.  Scroll down until you find

Click the arrow in front of WER-PayloadHealth

Click on Operational.

Click on Disable Log


log2.jpg


  • 0

Advertisements


#17
Matias Cooke

Matias Cooke

    Member

  • Topic Starter
  • Member
  • PipPip
  • 62 posts

Okay, I disabled every log that ended in .evtx except for the ones that ended in security. Those I don't know where to find them. I left you a picture for you to see what I'm talking about. 

It's the first one. 


Attached Thumbnails

  • Captura de pantalla (6).png

  • 0

#18
RKinner

RKinner

    Malware Expert

  • Expert
  • 24,598 posts
  • MVP

You don't want to disable security so that's fine.   Has disabling the logging helped the disk activity?   What does resource monitor show now? 


  • 0

#19
Matias Cooke

Matias Cooke

    Member

  • Topic Starter
  • Member
  • PipPip
  • 62 posts

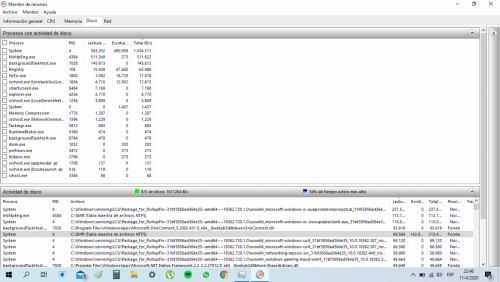
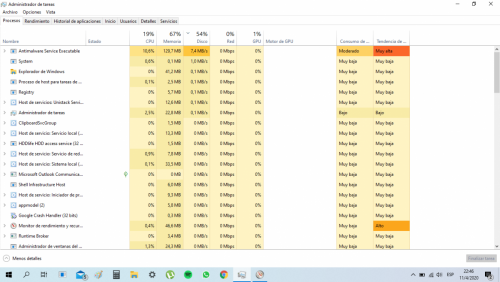
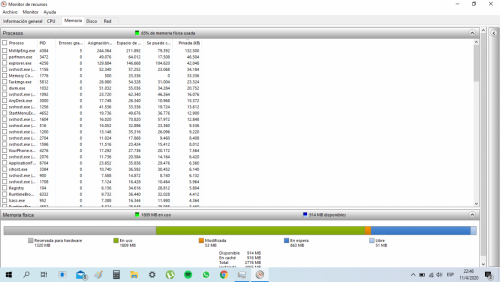
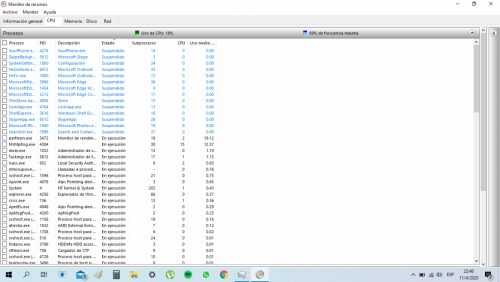
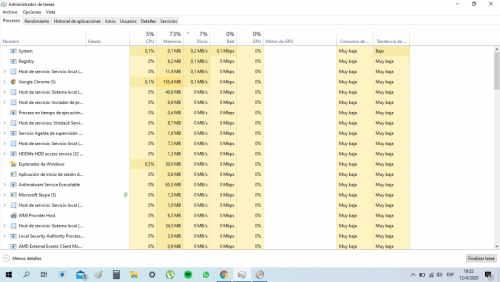
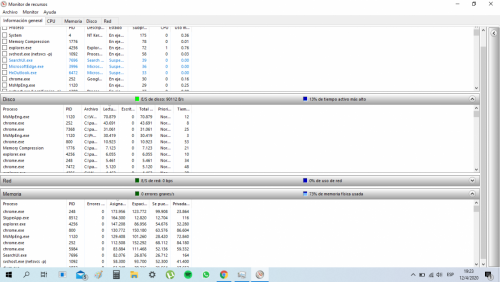
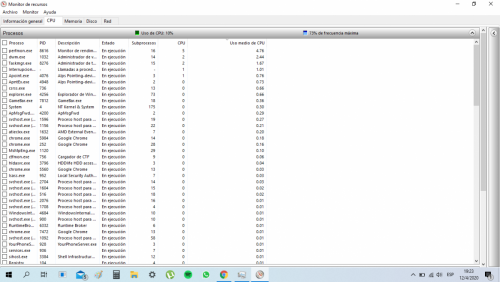
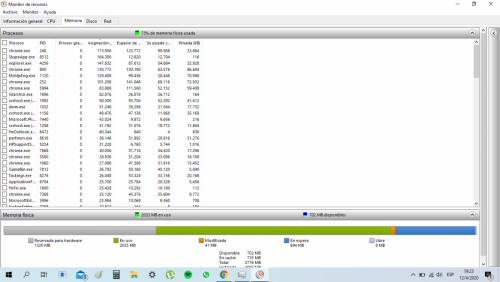
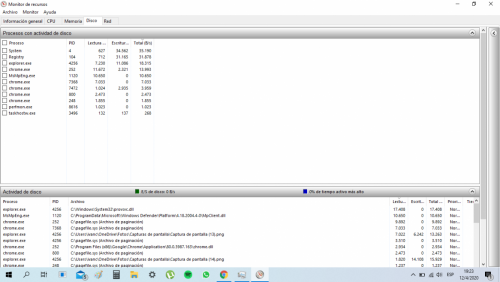
Everything still runs pretty slow. I took some screenshots of the resource monitor and the task manager. Hope those help. 


Attached Thumbnails

  • Captura de pantalla (7).png
  • Captura de pantalla (10).png
  • Captura de pantalla (8).png
  • Captura de pantalla (9).png

  • 0

#20
RKinner

RKinner

    Malware Expert

  • Expert
  • 24,598 posts
  • MVP

Looks like an update is stuck.


See if the troubleshooter for Windows Update finds anything:


https://support.micr...e-a-fix-it-tool


  • 0

#21
Matias Cooke

Matias Cooke

    Member

  • Topic Starter
  • Member
  • PipPip
  • 62 posts

It found something but it fixed it. I ran the troubleshooter again to be safe and it didn't find anything else. What should I do next?


  • 0

#22
RKinner

RKinner

    Malware Expert

  • Expert
  • 24,598 posts
  • MVP

What does Resource Monitor say now?


  • 0

#23
Matias Cooke

Matias Cooke

    Member

  • Topic Starter
  • Member
  • PipPip
  • 62 posts

I don't really know how to read the resource monitor, but here are some screenshots of it and the task manager. The percentages are still pretty high. 

Attached Thumbnails

  • Captura de pantalla (11).png
  • Captura de pantalla (12).png
  • Captura de pantalla (13).png
  • Captura de pantalla (14).png
  • Captura de pantalla (15).png

  • 0

#24
RKinner

RKinner

    Malware Expert

  • Expert
  • 24,598 posts
  • MVP

Actually I think we fixed it.  Your disk usage is down to 7% and CPU looks good too.


Let's try Latency Monitor:

Go to

http://www.resplendence.com/downloads

Scroll down to

System Monitoring Tools

and then find

LatencyMon 6.70 (or it may be a higher number if they update)

Click on Download free home edition

Save it then right click and Run As Admin.  It will install and then start the program.  
It will tell you to click on the Start button but there isn't one.  
Instead click on the green arrowhead (looks like a Play button).   Let it run for at least 20 seconds.  Then hit the red box to stop it.

Edit, Copy Report text to Clipboard then move to a REPLY and Ctrl + v to paste the text into a reply.


  • 0

#25
Matias Cooke

Matias Cooke

    Member

  • Topic Starter
  • Member
  • PipPip
  • 62 posts

I got distracted and let it run for longer. Sorry. Here it is. 


_________________________________________________________________________________________________________
CONCLUSION
_________________________________________________________________________________________________________
Your system seems to be having difficulty handling real-time audio and other tasks. You may experience drop outs, clicks or pops due to buffer underruns. One or more DPC routines that belong to a driver running in your system appear to be executing for too long. At least one detected problem appears to be network related. In case you are using a WLAN adapter, try disabling it to get better results. One problem may be related to power management, disable CPU throttling settings in Control Panel and BIOS setup. Check for BIOS updates. 
LatencyMon has been analyzing your system for  0:01:17  (h:mm:ss) on all processors.
 
 
_________________________________________________________________________________________________________
SYSTEM INFORMATION
_________________________________________________________________________________________________________
Computer name:                                        DESKTOP-PAG6OF6
OS version:                                           Windows 10 , 10.0, build: 18363 (x64)
Hardware:                                             HP 14 Notebook PC, Hewlett-Packard, 22D0
CPU:                                                  AuthenticAMD AMD A4-6210 APU with AMD Radeon R3 Graphics 
Logical processors:                                   4
Processor groups:                                     1
RAM:                                                  2776 MB total
 
 
_________________________________________________________________________________________________________
CPU SPEED
_________________________________________________________________________________________________________
Reported CPU speed:                                   1797 MHz
 
Note: reported execution times may be calculated based on a fixed reported CPU speed. Disable variable speed settings like Intel Speed Step and AMD Cool N Quiet in the BIOS setup for more accurate results.
 
WARNING: the CPU speed that was measured is only a fraction of the CPU speed reported. Your CPUs may be throttled back due to variable speed settings and thermal issues. It is suggested that you run a utility which reports your actual CPU frequency and temperature. 


_________________________________________________________________________________________________________
MEASURED INTERRUPT TO USER PROCESS LATENCIES
_________________________________________________________________________________________________________
The interrupt to process latency reflects the measured interval that a usermode process needed to respond to a hardware request from the moment the interrupt service routine started execution. This includes the scheduling and execution of a DPC routine, the signaling of an event and the waking up of a usermode thread from an idle wait state in response to that event.
 
Highest measured interrupt to process latency (µs):   689,20
Average measured interrupt to process latency (µs):   15,943208
 
Highest measured interrupt to DPC latency (µs):       665,80
Average measured interrupt to DPC latency (µs):       5,585396
 
 
_________________________________________________________________________________________________________
 REPORTED ISRs
_________________________________________________________________________________________________________
Interrupt service routines are routines installed by the OS and device drivers that execute in response to a hardware interrupt signal.
 
Highest ISR routine execution time (µs):              424,934335
Driver with highest ISR routine execution time:       ndis.sys - Especificación de interfaz de controlador de red (NDIS), Microsoft Corporation
 
Highest reported total ISR routine time (%):          0,022631
Driver with highest ISR total time:                   ndis.sys - Especificación de interfaz de controlador de red (NDIS), Microsoft Corporation
 
Total time spent in ISRs (%)                          0,026997
 
ISR count (execution time <250 µs):                   2033
ISR count (execution time 250-500 µs):                0
ISR count (execution time 500-999 µs):                4
ISR count (execution time 1000-1999 µs):              0
ISR count (execution time 2000-3999 µs):              0
ISR count (execution time >=4000 µs):                 0
 
 
_________________________________________________________________________________________________________
REPORTED DPCs
_________________________________________________________________________________________________________
DPC routines are part of the interrupt servicing dispatch mechanism and disable the possibility for a process to utilize the CPU while it is interrupted until the DPC has finished execution.
 
Highest DPC routine execution time (µs):              1225,193656
Driver with highest DPC routine execution time:       ndis.sys - Especificación de interfaz de controlador de red (NDIS), Microsoft Corporation
 
Highest reported total DPC routine time (%):          0,086460
Driver with highest DPC total execution time:         dxgkrnl.sys - DirectX Graphics Kernel, Microsoft Corporation
 
Total time spent in DPCs (%)                          0,273485
 
DPC count (execution time <250 µs):                   64397
DPC count (execution time 250-500 µs):                0
DPC count (execution time 500-999 µs):                246
DPC count (execution time 1000-1999 µs):              1
DPC count (execution time 2000-3999 µs):              0
DPC count (execution time >=4000 µs):                 0
 
 
_________________________________________________________________________________________________________
 REPORTED HARD PAGEFAULTS
_________________________________________________________________________________________________________
Hard pagefaults are events that get triggered by making use of virtual memory that is not resident in RAM but backed by a memory mapped file on disk. The process of resolving the hard pagefault requires reading in the memory from disk while the process is interrupted and blocked from execution.
 
NOTE: some processes were hit by hard pagefaults. If these were programs producing audio, they are likely to interrupt the audio stream resulting in dropouts, clicks and pops. Check the Processes tab to see which programs were hit.
 
Process with highest pagefault count:                 svchost.exe
 
Total number of hard pagefaults                       59
Hard pagefault count of hardest hit process:          33
Number of processes hit:                              12
 
 
_________________________________________________________________________________________________________
 PER CPU DATA
_________________________________________________________________________________________________________
CPU 0 Interrupt cycle time (s):                       2,785799
CPU 0 ISR highest execution time (µs):                424,934335
CPU 0 ISR total execution time (s):                   0,080897
CPU 0 ISR count:                                      1808
CPU 0 DPC highest execution time (µs):                1225,193656
CPU 0 DPC total execution time (s):                   0,693888
CPU 0 DPC count:                                      61154
_________________________________________________________________________________________________________
CPU 1 Interrupt cycle time (s):                       2,398226
CPU 1 ISR highest execution time (µs):                47,507513
CPU 1 ISR total execution time (s):                   0,000240
CPU 1 ISR count:                                      24
CPU 1 DPC highest execution time (µs):                528,678353
CPU 1 DPC total execution time (s):                   0,132711
CPU 1 DPC count:                                      2995
_________________________________________________________________________________________________________
CPU 2 Interrupt cycle time (s):                       0,877256
CPU 2 ISR highest execution time (µs):                13,490262
CPU 2 ISR total execution time (s):                   0,000043
CPU 2 ISR count:                                      7
CPU 2 DPC highest execution time (µs):                523,008347
CPU 2 DPC total execution time (s):                   0,014556
CPU 2 DPC count:                                      414
_________________________________________________________________________________________________________
CPU 3 Interrupt cycle time (s):                       0,422962
CPU 3 ISR highest execution time (µs):                47,481914
CPU 3 ISR total execution time (s):                   0,002039
CPU 3 ISR count:                                      198
CPU 3 DPC highest execution time (µs):                84,943239
CPU 3 DPC total execution time (s):                   0,001856
CPU 3 DPC count:                                      81
_________________________________________________________________________________________________________

  • 0

Advertisements


#26
RKinner

RKinner

    Malware Expert

  • Expert
  • 24,598 posts
  • MVP

Download OOSU10.exe:

https://www.oo-softw...com/en/shutup10

Download and Save it (You will get a popup while it's downloading.  You can X out of it)
then Right click and Run As Admin.
Allow it to make a System Restore Point.
Click on Actions then on Apply Recommended Settings.

Close the program and reboot.

After each major update it's wise to rerun the program and Revert the changes.


Search for

task scheduler

hit Enter

Click on the arrow in front of Task Scheduler Library then

Click on the arrow in front of Microsoft

Click on the arrow in front of Windows

Click on Application Experience.  In the next pane to the right, right click on each Task and Disable.  Should be three tasks.

Click on Customer Experience Improvement Program.  In the next pane to the right, right click on each Task and Disable.  Should be two tasks.

Reboot


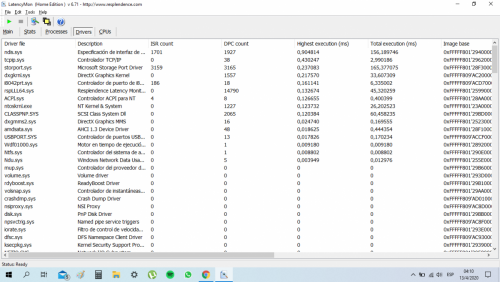
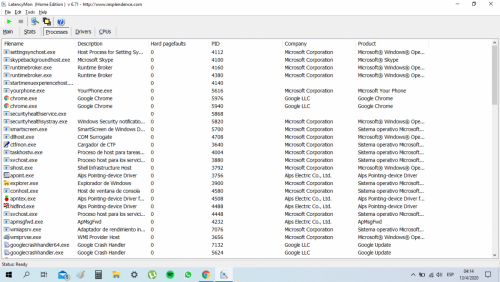
Rerun Latency Monitor for 20 seconds then stop it.  Click on the Drivers Tab.  Click on the column header for "Total execution (ms)" once or twice until the biggest numbers are at the top then take a screen shot and post it.  Click on the Processes tab then click on the column header once or twice until the big numbers are at the top.  Take a screen shot and post it.


  • 0

#27
Matias Cooke

Matias Cooke

    Member

  • Topic Starter
  • Member
  • PipPip
  • 62 posts

I couldn't seem to find the System Restore option anywhere. Also, I wasn't able to get the highest hitters for the processes tab to be on top. However, here are the screenshots. 


Attached Thumbnails

  • Captura de pantalla (16).png
  • Captura de pantalla (17).png

  • 0

#28
RKinner

RKinner

    Malware Expert

  • Expert
  • 24,598 posts
  • MVP

Usually it asks you when you run OOSU10 if you want to make a system restore point and you just have to answer yes or no.  Perhaps your PC does not have system restore turned on.  Nothing to worry about.


If there are no page faults that's a good thing.  You had 59 before but perhaps OOSU10 or the task scheduler stuff helped or maybe it was just because they didn't happen in a shorter time.


I forgot to ask for the summary.  I assume it still said it wasn't suitable?


Right now the problem appears to be with the network.


Do you need Anydesk?  (For that matter did you install it?)  If you are not using it to remotely control this PC while we work on it then either uninstall it or go in to Task Manager, Startup and disable it.  Also disable

uTorrent.


Reboot.


Go to

chrome://settings/


Find:

On Startup

 Click on

Open The New Tab Page.


Find:

Search engine
Search engine used in the address bar - change to Google


Click on Manage search engines

For each search engine except Google under Default Search Engines, click on the three bars and select Remove From List.


Scroll to the bottom and click on Advanced.


Now scroll to where it says System and turn off


Continue running background apps when Google Chrome is closed
 

Under

Privacy and security


turn off:


Preload pages for faster browsing and searching


That should cut down the number of Chrome.exe programs running.  Restart Chrome so that the changes take effect.


Rerun Latency Monitor for 20 seconds as before.  If it still says the system is not suitable then try shutting down Chrome while you run Latency Monitor or disabling your network adapter (Search for

device manager

hit Enter

Find the network adapter you are using and rightclick and disable. ) Then rerun Latency Monitor. 


  • 0

#29
Matias Cooke

Matias Cooke

    Member

  • Topic Starter
  • Member
  • PipPip
  • 62 posts
Did everything. Now it says it's suitable. Here's the summary just to be safe.


___________________________________
 
CONCLUSION
___________________________________
Your system appears to be suitable for handling real-time audio and other tasks without dropouts. 
LatencyMon has been analyzing your system for  0:00:21  (h:mm:ss) on all processors.
 
 
___________________________________
SYSTEM INFORMATION
___________________________________
Computer name:                                        DESKTOP-PAG6OF6
OS version:                                           Windows 10 , 10.0, build: 18363 (x64)
Hardware:                                             HP 14 Notebook PC, Hewlett-Packard, 22D0
CPU:                                                  AuthenticAMD AMD A4-6210 APU with AMD Radeon R3 Graphics 
Logical processors:                                   4
Processor groups:                                     1
RAM:                                                  2776 MB total
 
 
___________________________________
CPU SPEED
___________________________________
Reported CPU speed:                                   1797 MHz
 
Note: reported execution times may be calculated based on a fixed reported CPU speed. Disable variable speed settings like Intel Speed Step and AMD Cool N Quiet in the BIOS setup for more accurate results.
 
WARNING: the CPU speed that was measured is only a fraction of the CPU speed reported. Your CPUs may be throttled back due to variable speed settings and thermal issues. It is suggested that you run a utility which reports your actual CPU frequency and temperature. 


___________________________________
MEASURED INTERRUPT TO USER PROCESS LATENCIES
___________________________________
The interrupt to process latency reflects the measured interval that a usermode process needed to respond to a hardware request from the moment the interrupt service routine started execution. This includes the scheduling and execution of a DPC routine, the signaling of an event and the waking up of a usermode thread from an idle wait state in response to that event.
 
Highest measured interrupt to process latency (µs):   997,90
Average measured interrupt to process latency (µs):   12,621851
 
Highest measured interrupt to DPC latency (µs):       981,20
Average measured interrupt to DPC latency (µs):       4,703331
 
 
___________________________________
 REPORTED ISRs
___________________________________
Interrupt service routines are routines installed by the OS and device drivers that execute in response to a hardware interrupt signal.
 
Highest ISR routine execution time (µs):              231,641068
Driver with highest ISR routine execution time:       ndis.sys - Especificación de interfaz de controlador de red (NDIS), Microsoft Corporation
 
Highest reported total ISR routine time (%):          0,035687
Driver with highest ISR total time:                   i8042prt.sys - Controlador de puerto de i8042, Microsoft Corporation
 
Total time spent in ISRs (%)                          0,062179
 
ISR count (execution time <250 µs):                   2631
ISR count (execution time 250-500 µs):                0
ISR count (execution time 500-999 µs):                0
ISR count (execution time 1000-1999 µs):              0
ISR count (execution time 2000-3999 µs):              0
ISR count (execution time >=4000 µs):                 0
 
 
___________________________________
REPORTED DPCs
___________________________________
DPC routines are part of the interrupt servicing dispatch mechanism and disable the possibility for a process to utilize the CPU while it is interrupted until the DPC has finished execution.
 
Highest DPC routine execution time (µs):              605,688370
Driver with highest DPC routine execution time:       ndis.sys - Especificación de interfaz de controlador de red (NDIS), Microsoft Corporation
 
Highest reported total DPC routine time (%):          0,052754
Driver with highest DPC total execution time:         dxgkrnl.sys - DirectX Graphics Kernel, Microsoft Corporation
 
Total time spent in DPCs (%)                          0,206203
 
DPC count (execution time <250 µs):                   13624
DPC count (execution time 250-500 µs):                0
DPC count (execution time 500-999 µs):                49
DPC count (execution time 1000-1999 µs):              0
DPC count (execution time 2000-3999 µs):              0
DPC count (execution time >=4000 µs):                 0
 
 
___________________________________
 REPORTED HARD PAGEFAULTS
___________________________________
Hard pagefaults are events that get triggered by making use of virtual memory that is not resident in RAM but backed by a memory mapped file on disk. The process of resolving the hard pagefault requires reading in the memory from disk while the process is interrupted and blocked from execution.
 
NOTE: some processes were hit by hard pagefaults. If these were programs producing audio, they are likely to interrupt the audio stream resulting in dropouts, clicks and pops. Check the Processes tab to see which programs were hit.
 
Process with highest pagefault count:                 system
 
Total number of hard pagefaults                       86
Hard pagefault count of hardest hit process:          64
Number of processes hit:                              10
 
 
___________________________________
 PER CPU DATA
___________________________________
CPU 0 Interrupt cycle time (s):                       0,651022
CPU 0 ISR highest execution time (µs):                231,641068
CPU 0 ISR total execution time (s):                   0,043742
CPU 0 ISR count:                                      1854
CPU 0 DPC highest execution time (µs):                605,688370
CPU 0 DPC total execution time (s):                   0,147787
CPU 0 DPC count:                                      12457
___________________________________
CPU 1 Interrupt cycle time (s):                       0,147685
CPU 1 ISR highest execution time (µs):                81,592098
CPU 1 ISR total execution time (s):                   0,007334
CPU 1 ISR count:                                      399
CPU 1 DPC highest execution time (µs):                423,559265
CPU 1 DPC total execution time (s):                   0,016177
CPU 1 DPC count:                                      639
___________________________________
CPU 2 Interrupt cycle time (s):                       0,110727
CPU 2 ISR highest execution time (µs):                11,094602
CPU 2 ISR total execution time (s):                   0,000660
CPU 2 ISR count:                                      170
CPU 2 DPC highest execution time (µs):                361,063439
CPU 2 DPC total execution time (s):                   0,005508
CPU 2 DPC count:                                      332
___________________________________
CPU 3 Interrupt cycle time (s):                       0,082120
CPU 3 ISR highest execution time (µs):                12,181970
CPU 3 ISR total execution time (s):                   0,000921
CPU 3 ISR count:                                      208
CPU 3 DPC highest execution time (µs):                369,893712
CPU 3 DPC total execution time (s):                   0,005157
CPU 3 DPC count:                                      245
___________________________________

  • 0

#30
Matias Cooke

Matias Cooke

    Member

  • Topic Starter
  • Member
  • PipPip
  • 62 posts

I did a second run however (this time for 1 minute) and it said that the system was having trouble handling real time audio and other tasks. 


  • 0


Similar Topics


Also tagged with one or more of these keywords: virus, disk, slow, laptop

0 user(s) are reading this topic

0 members, 0 guests, 0 anonymous users

As Featured On:

Microsoft Yahoo BBC MSN PC Magazine Washington Post HP